User Guide
MountainCSV is organised as three full-screen workspaces — Data, SQL and Dashboard — that you switch between from the bar at the top of the window. This guide covers each of them, plus every panel and dialog, step by step with real screenshots.
Getting started
MountainCSV shows a Welcome screen whenever no file is open. From here you can open a file, paste CSV text straight from your clipboard, or start from scratch.
Opening a file Welcome screen · Data toolbar
MountainCSV reads CSV, TSV and other delimited text; Excel workbooks (.xlsx,
.xls, .xlsm, .xlsb); JSON, NDJSON and JSONL; and XML.
- From the Welcome screen, click Open file — or click Open on the Data toolbar at any time. Ctrl+O does the same thing from anywhere.
- Pick your file in the native file dialog. The delimiter, text encoding and header row are detected automatically.
- Each file opens in its own tab, so you can keep several open side by side — which is what Join, Union and Compare work across.
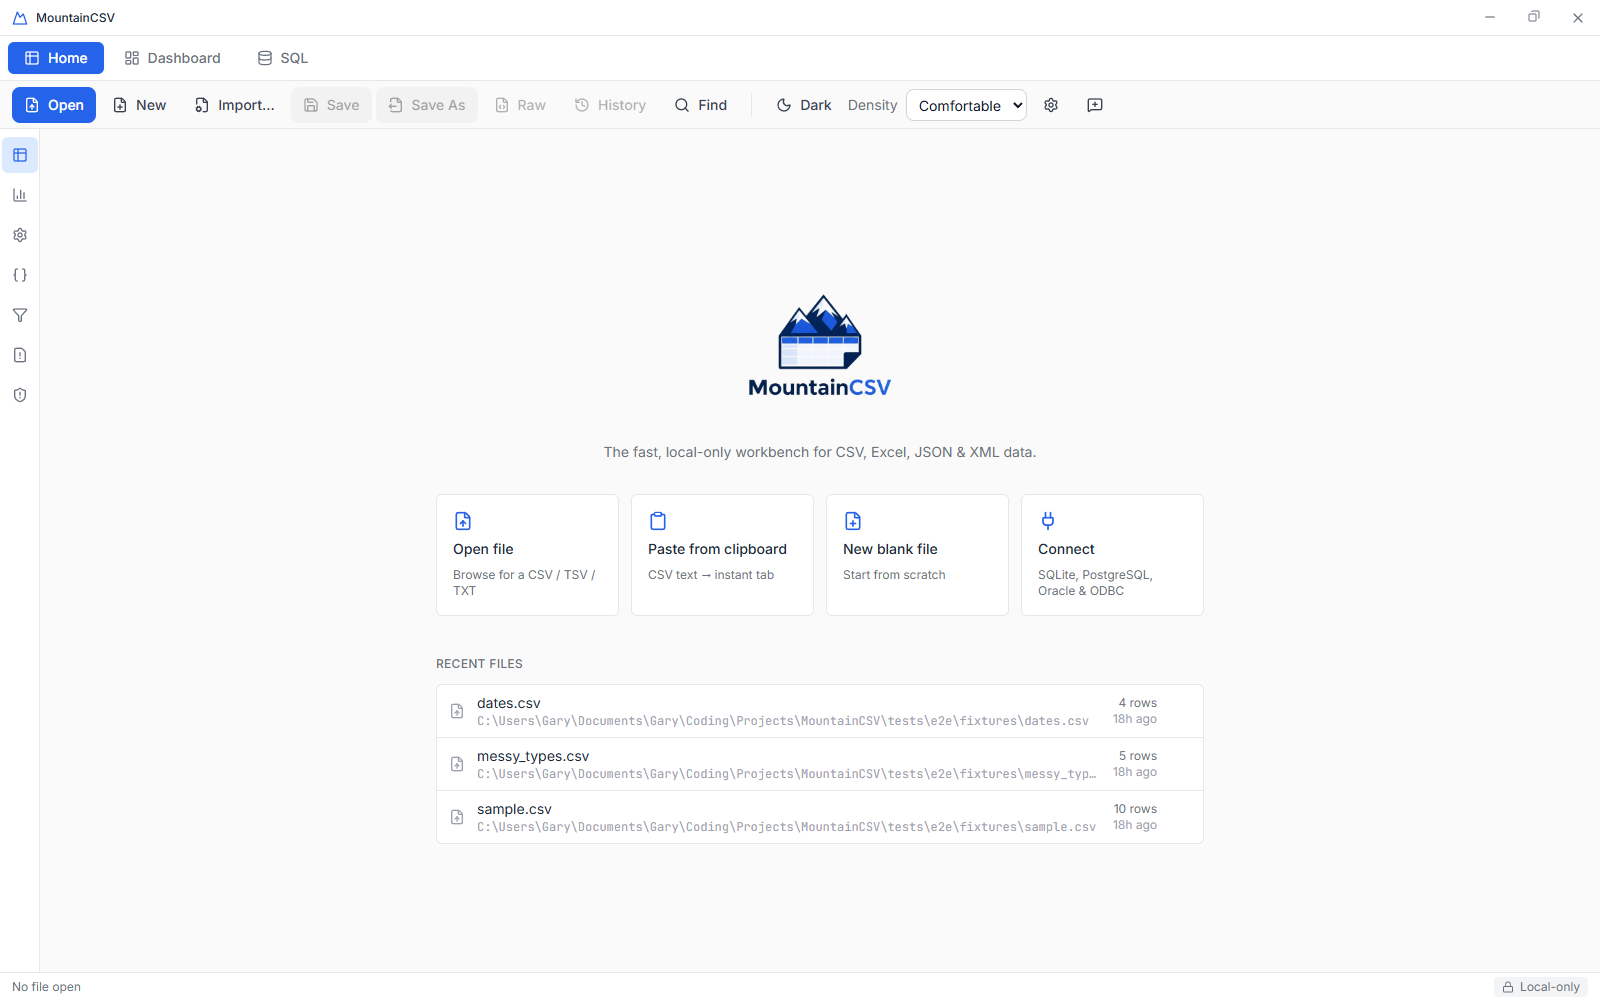
The Welcome screen — shown whenever no file is open.
Pasting CSV text Welcome screen
If your data is already on your clipboard — copied out of an email, a chat message or another app — you don't need to save it to a file first.
- From the Welcome screen, click Paste from clipboard.
- Paste your text into the box. The delimiter and column types are detected automatically.
- Leave First row is a header ticked if your data starts with a header row —
those become your column names. Untick it if your data has no header; every row is then
kept as data and the columns are named
Column 1,Column 2, … . The hint under the box previews exactly what will happen either way. - Click Open as tab to load it, exactly like any other file.
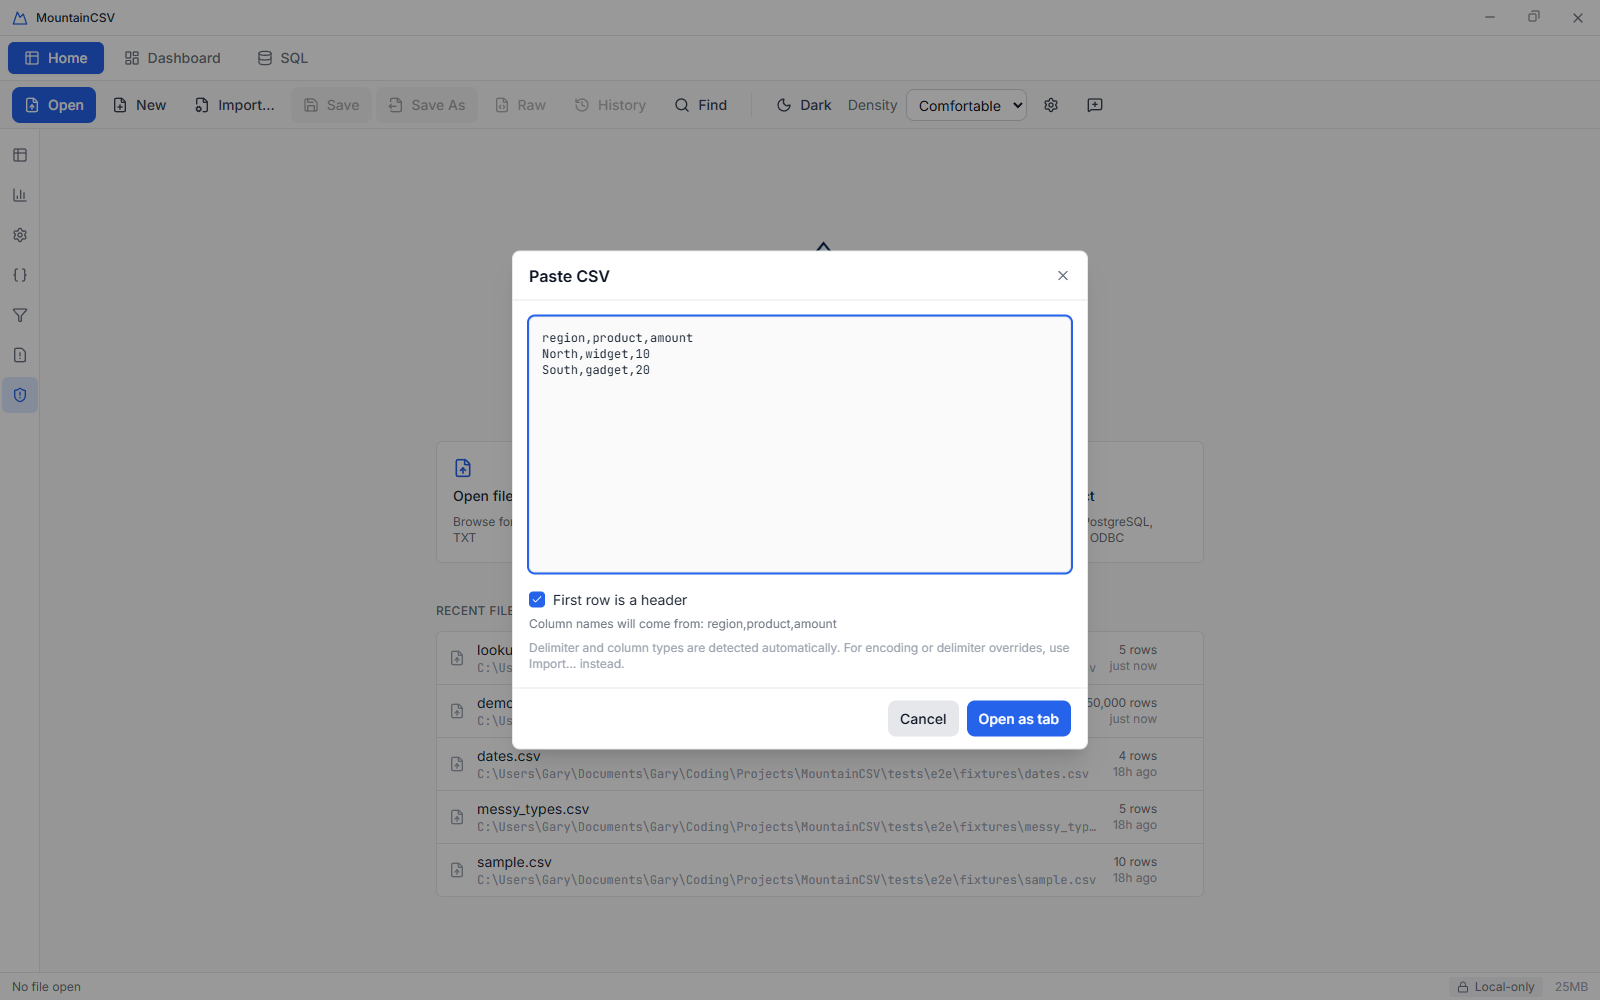
Pasted text is parsed immediately. Untick "First row is a header" for headerless data.
Starting from a blank file Welcome screen · Data toolbar → New
To build a small table from scratch, spreadsheet-style, start with nothing and add rows and columns as you go.
- Click New blank file on the Welcome screen, or New on the Data toolbar if a file is already open.
- A new tab opens with one column ("Column 1") and no rows.
- Right-click a column header and choose Insert Blank Column to add columns, and right-click anywhere in the grid and choose Insert Blank Row to add rows — see Copy, insert, duplicate & delete rows and Insert Blank Column.
- Double-click any cell to start typing values.
Recent files Welcome screen
The Welcome screen keeps a list of files you've opened before, with their row count and how long ago you last opened them.
- Click any entry in the Recent files list to reopen it directly.
- Hover an entry and click the × to remove it from the list. This doesn't delete the file itself.
Import with options Data toolbar → Import…
Use Import… rather than Open when detection needs overriding, or when you want to check what will be parsed before committing.
- Click Import… and pick a file. The Import Preview opens.
- Override the Encoding (UTF-8, UTF-8 BOM, UTF-16 LE/BE, ISO-8859-1, Windows-1252, Windows-1251, GBK, Shift_JIS) or the Delimiter (comma, tab, semicolon, pipe, or a custom character).
- Untick First row is header for headerless data, or set Header row if the real header sits a few lines down.
- The preview table, detected line ending and estimated row count update as you change the settings. When it looks right, confirm to load the file.
Fixed-width files
Mainframe and legacy exports often align columns with spaces instead of delimiters. The Import Preview handles them: switch the mode at the top of the dialog from Delimited to Fixed width.
- MountainCSV samples the file and detects the column breaks automatically — positions where nearly every line has a shared column of spaces.
- The preview shows your raw lines under a character ruler, with a vertical guide at every break. Click the ruler to add or remove a break; the live column count updates as you do.
- Tick First row is header to take column names from the first line (blank cells become Column N; duplicates get a suffix), untick it for Column 1…N.
- Click Import. Fields are trimmed, internal spaces are kept ("Bob Smith" stays one value), and short lines pad with empty cells instead of erroring.
Connecting to a database Welcome screen → Connect
MountainCSV can pull a table straight out of a database without exporting it to CSV
first. The Connect dialog covers three kinds of source: SQLite files
(.db, .sqlite, .sqlite3), PostgreSQL
servers, and ODBC — which is how Oracle and anything
else with an ODBC driver connects.
- On the welcome screen, click Connect and pick the source at the top of the dialog.
- SQLite: choose the database file. It's read on your machine by a built-in reader — no server, no credentials, works offline.
- PostgreSQL: enter a connection string and click Connect — a built-in client, nothing downloaded.
- ODBC (Windows): build the connection from fields instead of wrestling
a connection string together by hand. Pick the installed driver, then how
to reach the database: a TNS name (Oracle — read from your
tnsnames.oraor an unzipped cloud wallet), Host & port, a saved DSN from the Windows ODBC panel, or a raw connection string if you already have one. A preview shows exactly what will be sent, with the password hidden. - Once connected, the database's tables appear in a picker grouped by schema, with a search box that filters by schema, table or column name. Click Import on the table you want. It opens as a normal tab — filter it, chart it, edit it and export it like any other file.
Oracle and TNS names: the TNS list is read from a local
tnsnames.ora, or from a cloud wallet folder you point the dialog at. If your
organisation resolves database names through an LDAP directory instead,
there is no local file to read and that isn't supported — the dialog says so, and
Host & port connects without needing any file.
None of this talks to us. The only network activity is the connection you configure yourself, from your machine straight to your own database — and SQLite involves no network at all.
Saved connections: connections aren't stored unless you choose to save one. Give it a name, set a master password the first time, and it's encrypted on this machine (PBKDF2-derived key, authenticated encryption) — the password itself is never written anywhere, and a wrong password or a tampered store refuses to open rather than leaking anything. Unlock once per session to fill a saved string with one click.
Importing copies the table in as it is now. To query a database live — and join it against your files — see Attaching a database in the SQL workspace.
When rows can’t be read Any file
Real exports are sometimes damaged — a row with a missing comma, a stray quote mark, a truncated line. MountainCSV loads everything it can rather than refusing the whole file, and then tells you what it had to leave out.
- If any rows were skipped, a warning appears after loading saying how many.
- Click Show me to see them, grouped by what went wrong — “too few values”, “too many values”, “stray quote mark” and so on — with the exact text of each line as it appears in your file.
- If nearly every skipped line failed the same way, that usually means the file was read with the wrong separator rather than being broken. The panel says so, and you can reopen it with Import… and pick a different one.
This matters because a file that quietly loads short makes every count, chart and export afterwards wrong, with nothing to explain why. Skipped rows are never hidden.
The three workspaces
The bar directly under the title bar holds three buttons: Home (which becomes Data once a file is open), Dashboard and SQL. Clicking one swaps the whole screen. Your open tabs, filters and edits are shared across all three — only the surroundings change.
Data — clean and edit
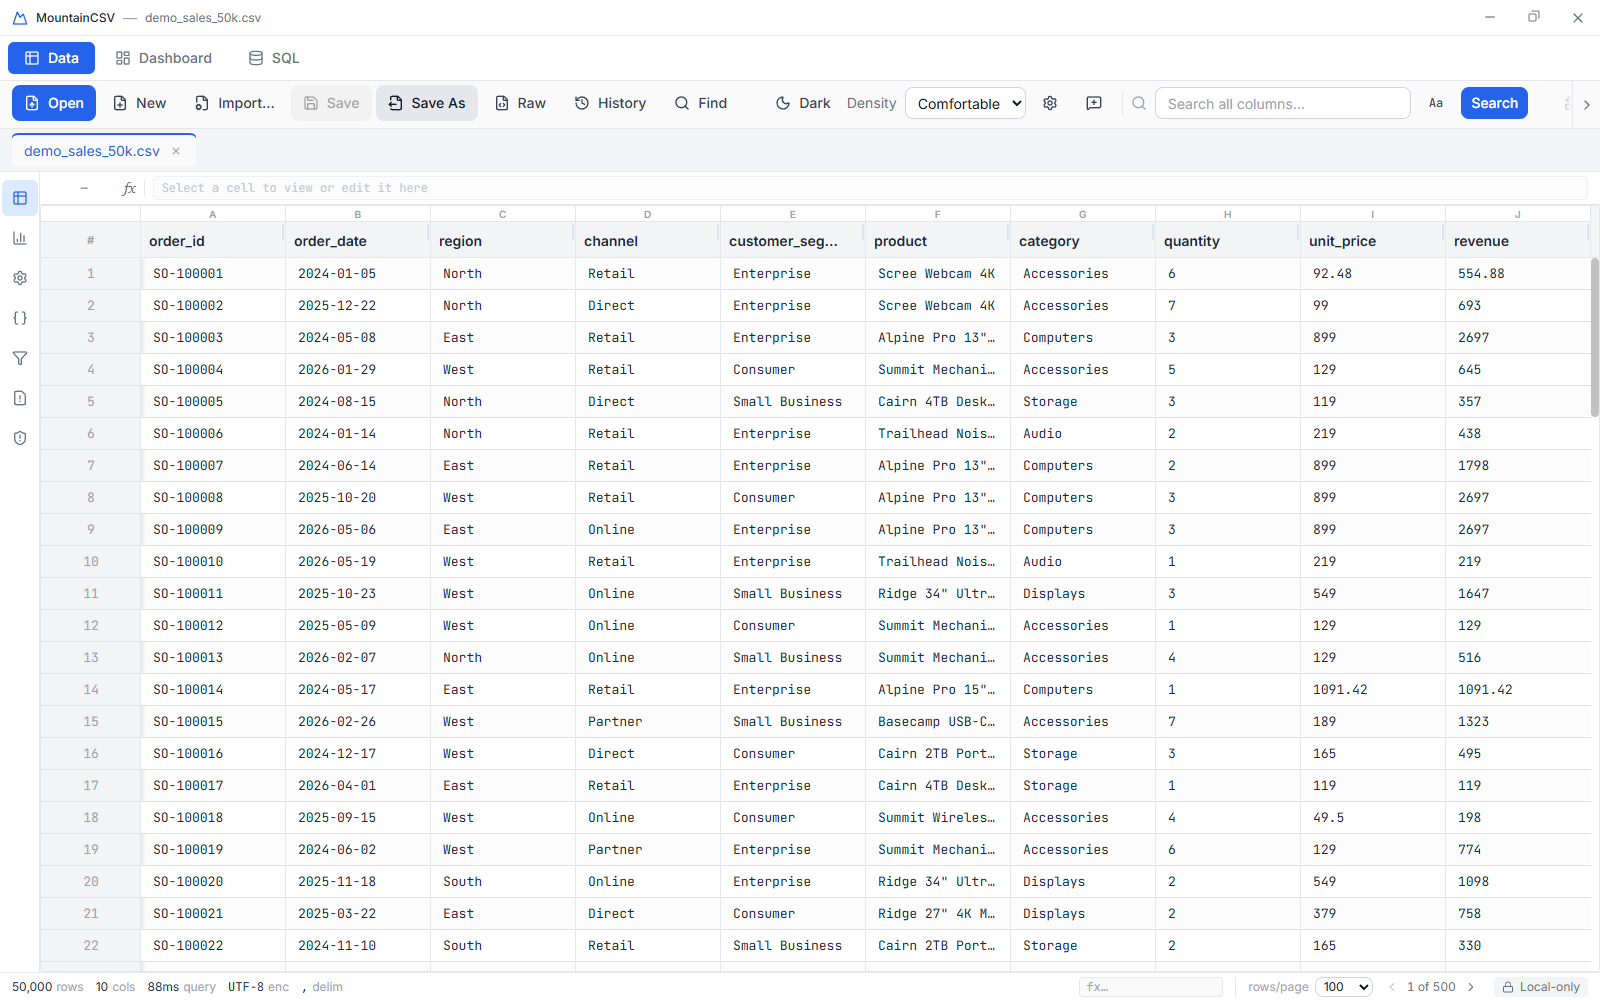
The data grid, full width, with one merged toolbar above it and a narrow icon rail down the left for the Column profile, Columns, Filters and Validation panels. This is where you fix a file: edit cells, search, filter, find & replace, convert types, format and export.
SQL — query and reshape
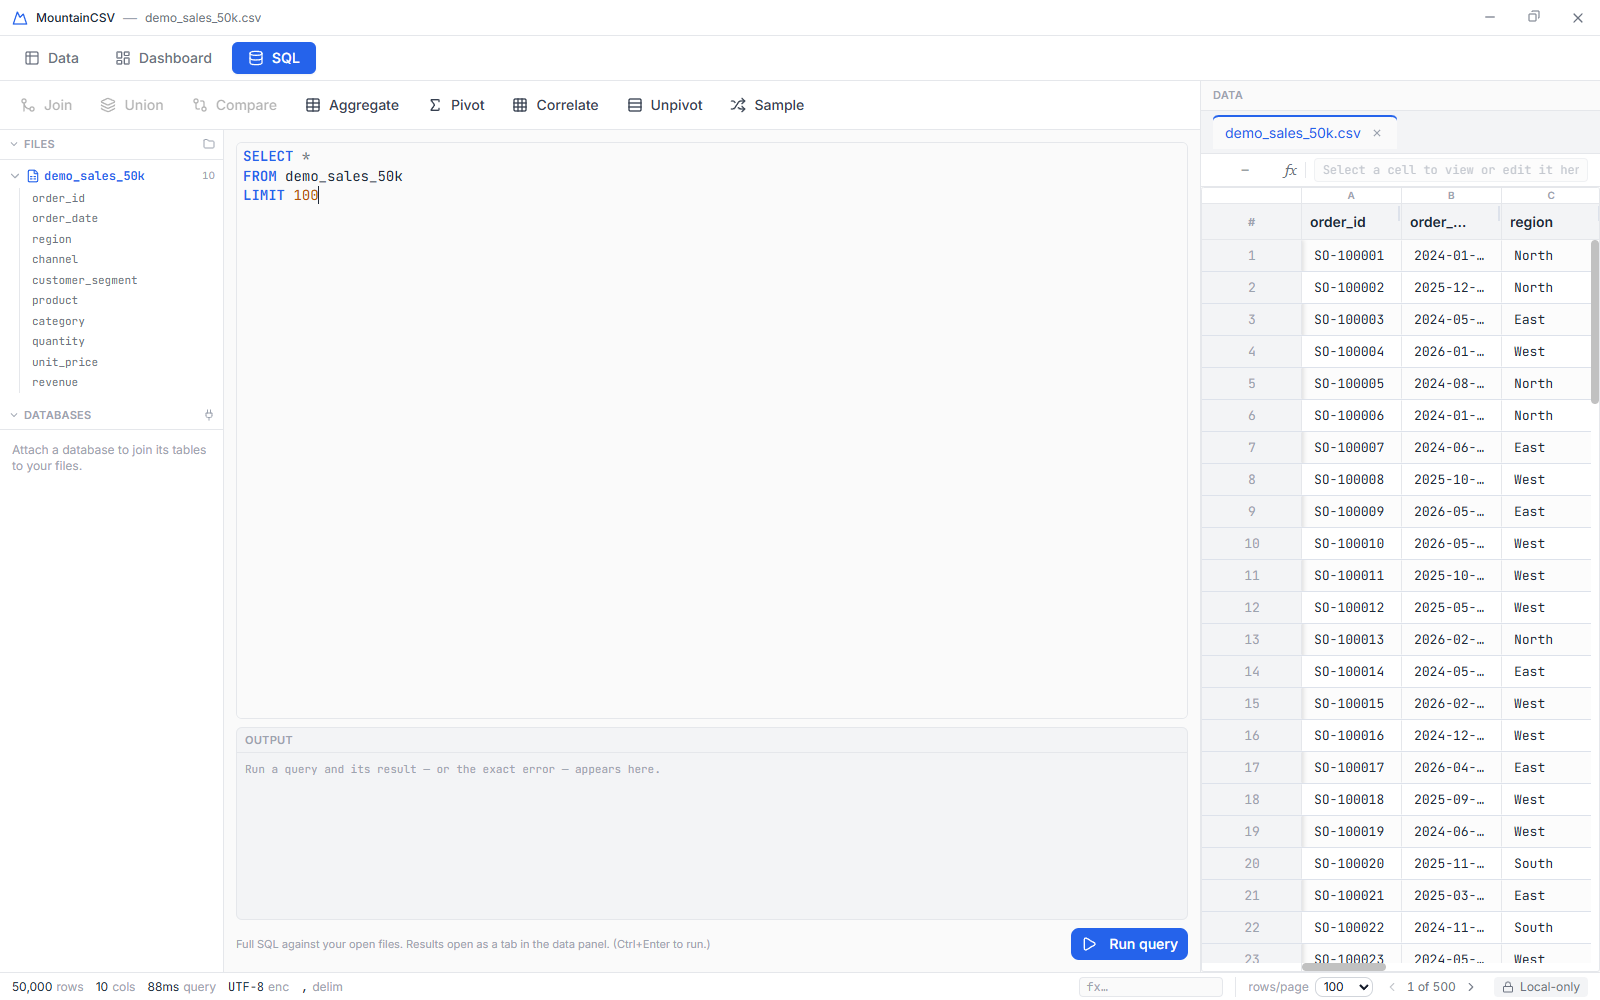
The main area holds the reshape toolbar (Join, Union, Compare, Aggregate, Pivot, Correlate, Unpivot, Sample), a Tables tree listing every open file and its columns, and the SQL editor. Your data grid moves to a smaller panel on the right, so query results — which open as new tabs — appear right next to the source data.
Dashboard — chart and report
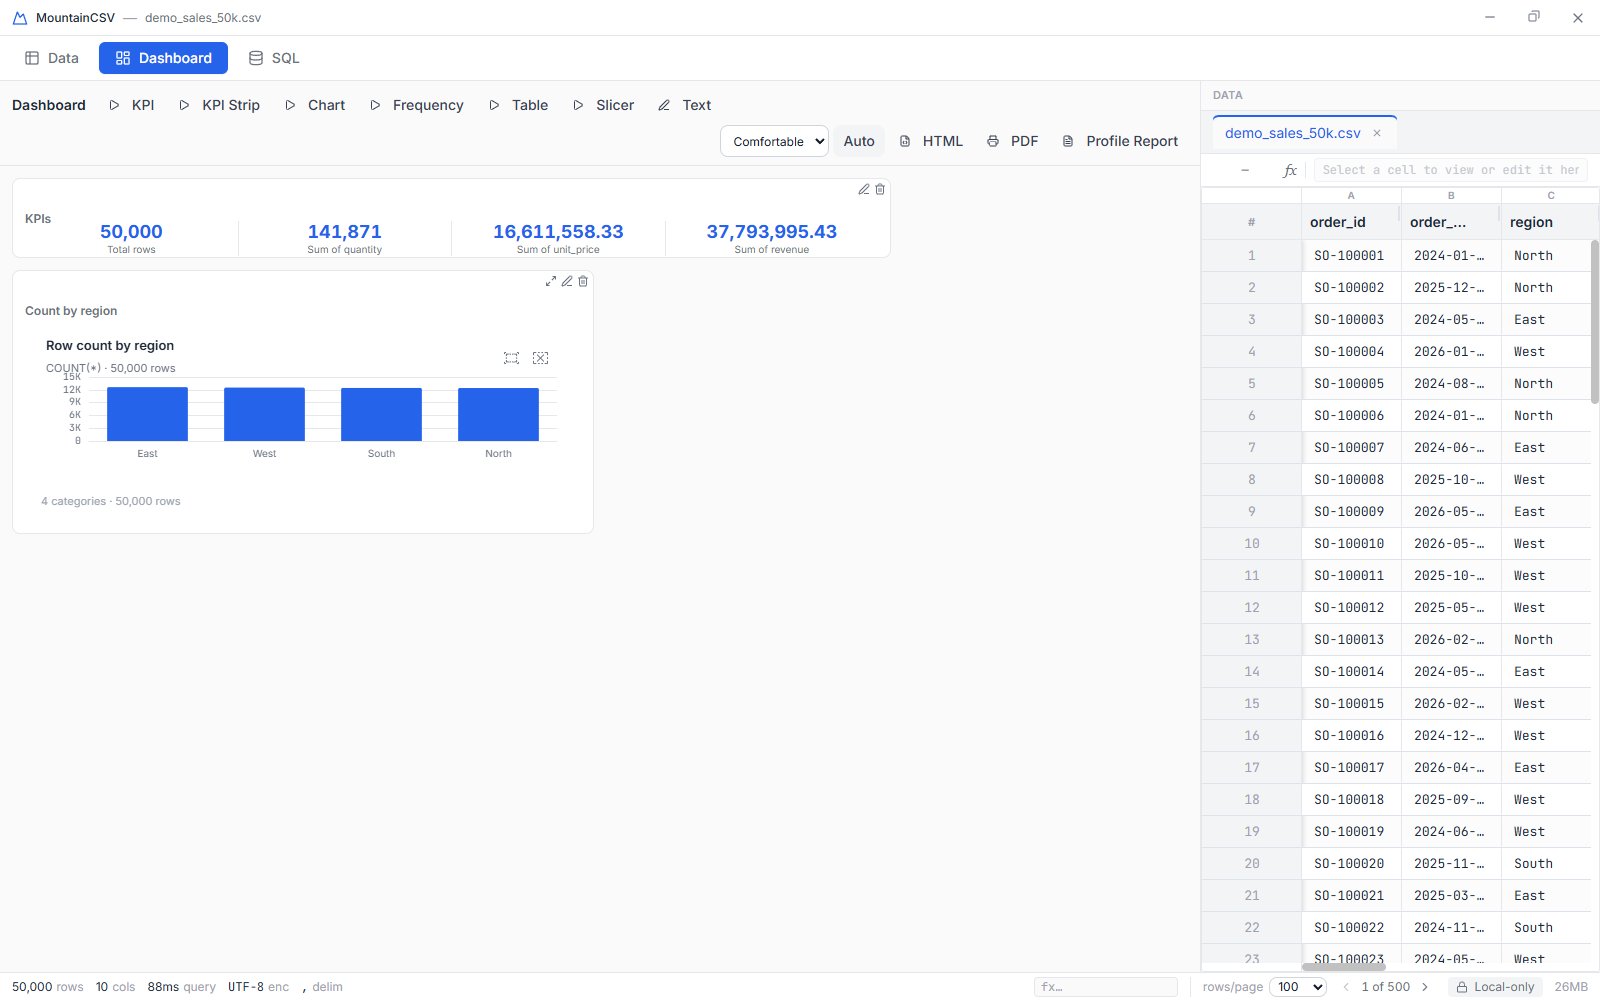
The main area is a dashboard canvas built from KPI, chart, table and text tiles, with the data grid again in a panel on the right. Charts here cross-filter that grid, and the whole board exports to a self-contained HTML file or a PDF.
Tabs
- Every file, query result and reshape result gets its own tab. The tab bar appears above the grid in all three workspaces.
- Click a tab to switch to it. Switching is instant — each tab keeps its own table in the engine, so nothing is re-read from disk.
- A ● after the file name means that tab has unsaved edits.
- Click the × on a tab to close it.
Data workspace
The grid behaves like a spreadsheet for viewing and light editing, backed by a real analytical database for everything else — so it stays fast no matter how large the file is.
The toolbar
There is one toolbar, and everything on it is visible at once. The file actions are always present; the data tools join them as soon as a file is open.
- Always: Open, New, Import…, Save, Save As, the Dark/Light theme toggle, the Density dropdown, and the gear icon for Settings.
- With a file open, also: the Search box, Find & Replace, Merge, Format, the Row # go-to box, Export and Recipe.
- Save is only enabled while the tab has unsaved changes; it writes back over the file you opened. Save As asks for a new destination.
The grid
A row-number gutter runs down the left edge using global numbers, so page 2 continues 101, 102, … . A column letter (A, B, C…) sits above each column name. Those two together are the coordinates in-cell formulas use.
- Drag a column header to reorder columns. Column letters follow the new positions.
- Drag the divider between two headers to resize a column.
- Click the corner — the small # box above the row numbers, where the gutter meets the header — to fit every column to its contents at once, like the select-all corner in a spreadsheet.
- Rows flagged by Validation are highlighted in place, and conditional formatting rules colour matching cells.
Editing cells
- Double-click a cell, or select it and press F2, to start editing.
- Type the new value and press Enter to commit it, or Escape to cancel.
- Every edit is tracked — the tab shows a ● marker and the status bar shows ● unsaved until you save.
- Drag the small square at the bottom-right of the focused cell to fill downwards, or select the source row plus the rows below it and press Ctrl+D.
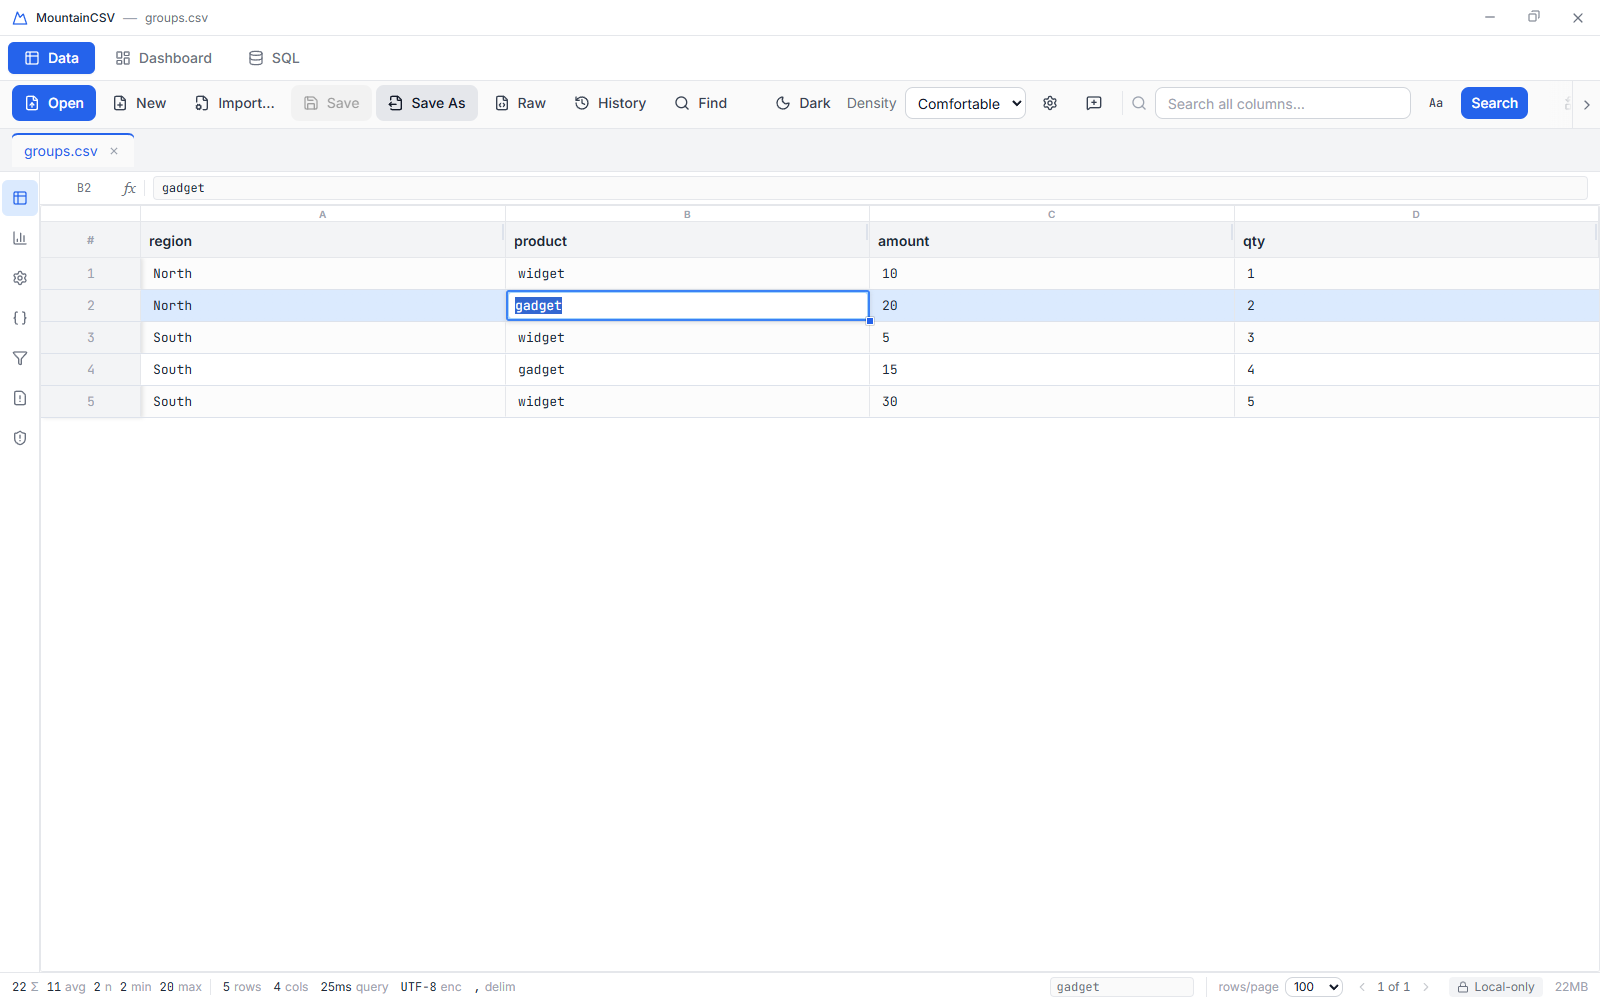
Formulas & the formula bar
Type an Excel-style formula into any cell — starting with = — and it computes live
from other cells. The column letters above each header and the row numbers down the gutter are the
addresses: A1 is simply the cell where column A meets row 1.
- Double-click a cell and type a formula, e.g.
=C1+10or=SUM(A1:A10), then press Enter. - The cell shows the computed result. Changing a cell a formula depends on recomputes it automatically.
- To see or edit a formula's actual text rather than its result, click the cell and use the formula bar above the grid. It shows the focused cell's address on the left, fx, then the live formula or plain value — editable in place.
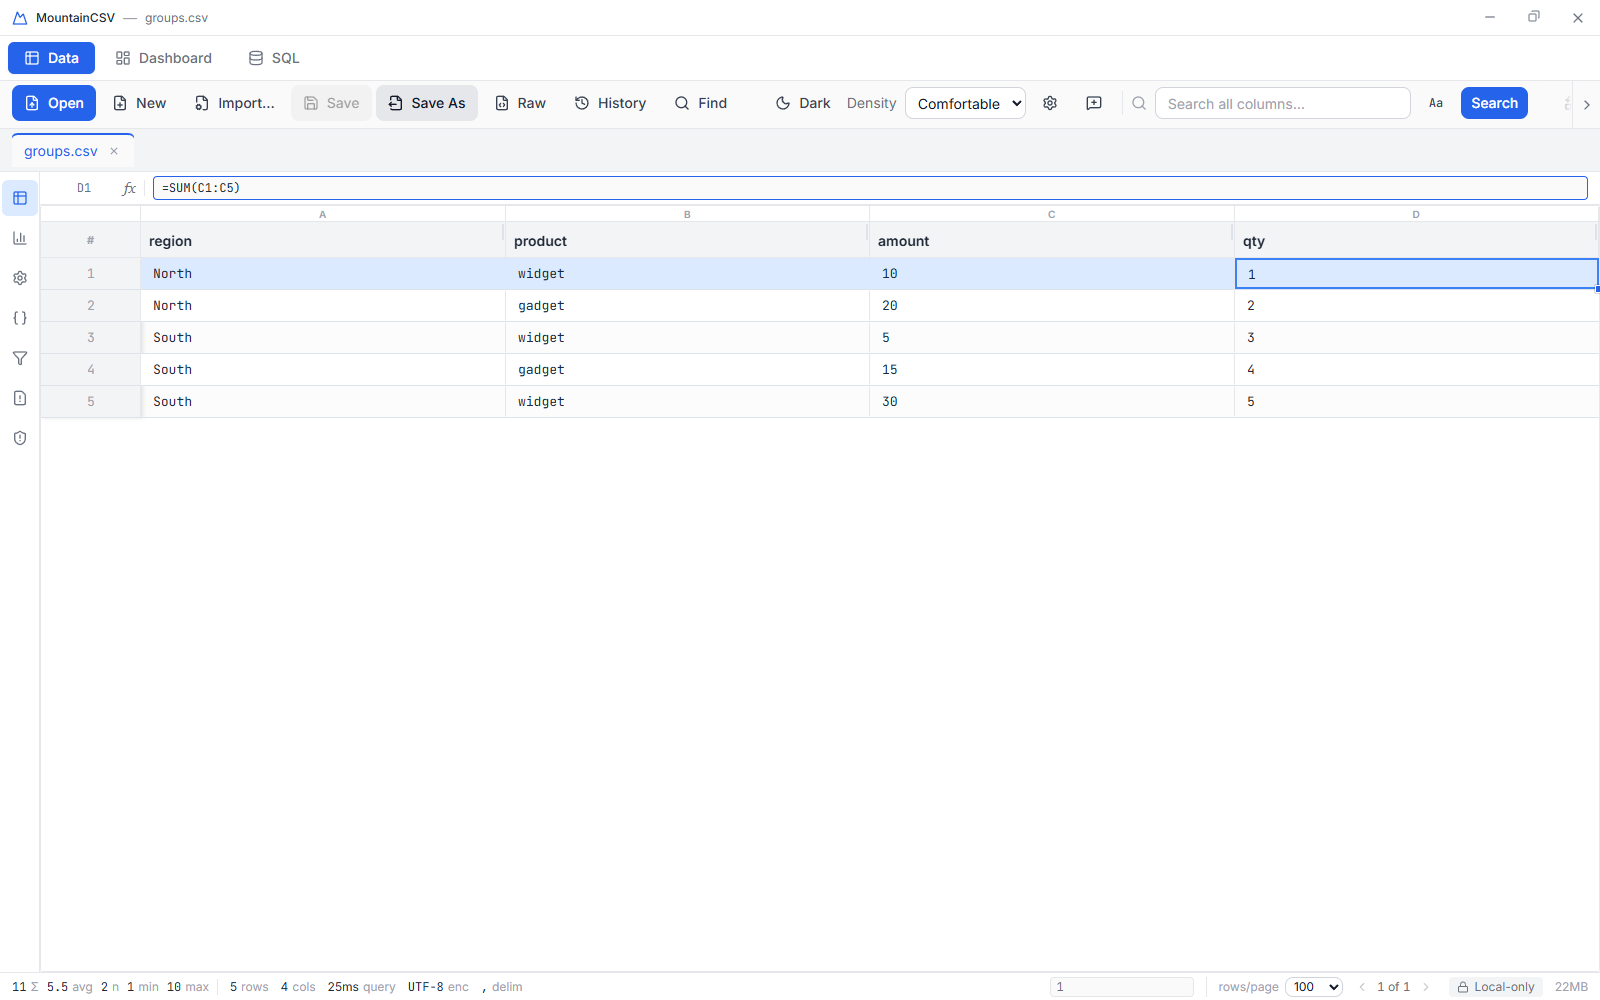
The formula bar is the reliable place to correct a formula — the cell itself only shows the result.
- References stick to the cell, not the letter. If you drag-reorder columns, an existing formula keeps pointing at the same data — only the letter that column now sits under changes.
- Formulas see the rows on the current page. Row numbers are global, and a
reference to a row that isn't currently loaded returns
#REF!. The gutter shows exactly which rows are in range. - Circular references are rejected, not silently accepted — a formula can't depend on itself, directly or through a chain.
Undo & redo
- Press Ctrl+Z (⌘+Z on macOS) to undo the last change.
- Press Ctrl+Shift+Z to redo.
- Undo covers every mutating action, not just typing — cell edits, column and row operations, find & replace, clean-up fixes and type conversions. History is kept per tab.
Sorting & filtering a column
Clicking a header does nothing on its own — that was too easy to trigger by accident on a large file. Both sorting and per-column filtering live in the small ⏷ button at the right-hand end of each header.
- Click ⏷ and choose Sort ascending, Sort descending or Clear sort. An arrow in the header shows the current direction.
- Choose Filter by value… for a spreadsheet-style checklist of that column's distinct values. Search within the list, tick the values you want to keep, and apply.
- When a column has a filter applied, its menu button shows a dot: ⏷●.
Search
- Type into the Search all columns… box on the toolbar and press Enter, or click Search.
- The grid narrows to rows where any column contains your text.
- Press Ctrl+F from anywhere in the Data workspace to jump straight to the box.
- Click the ✕ beside the box to clear the search and every active filter at once.
Filter chips
Whenever anything is filtering the grid, a Filtered bar appears directly above it listing each active condition as a chip — no matter whether it came from a column filter, the Filters panel, a search, the Validation panel, or a click on a chart.
- Read the chip to see the exact condition, e.g.
region = Northoramount ≥ 100. - Click a chip's ✕ to drop just that condition.
- Click Clear all at the right-hand end to remove the lot.
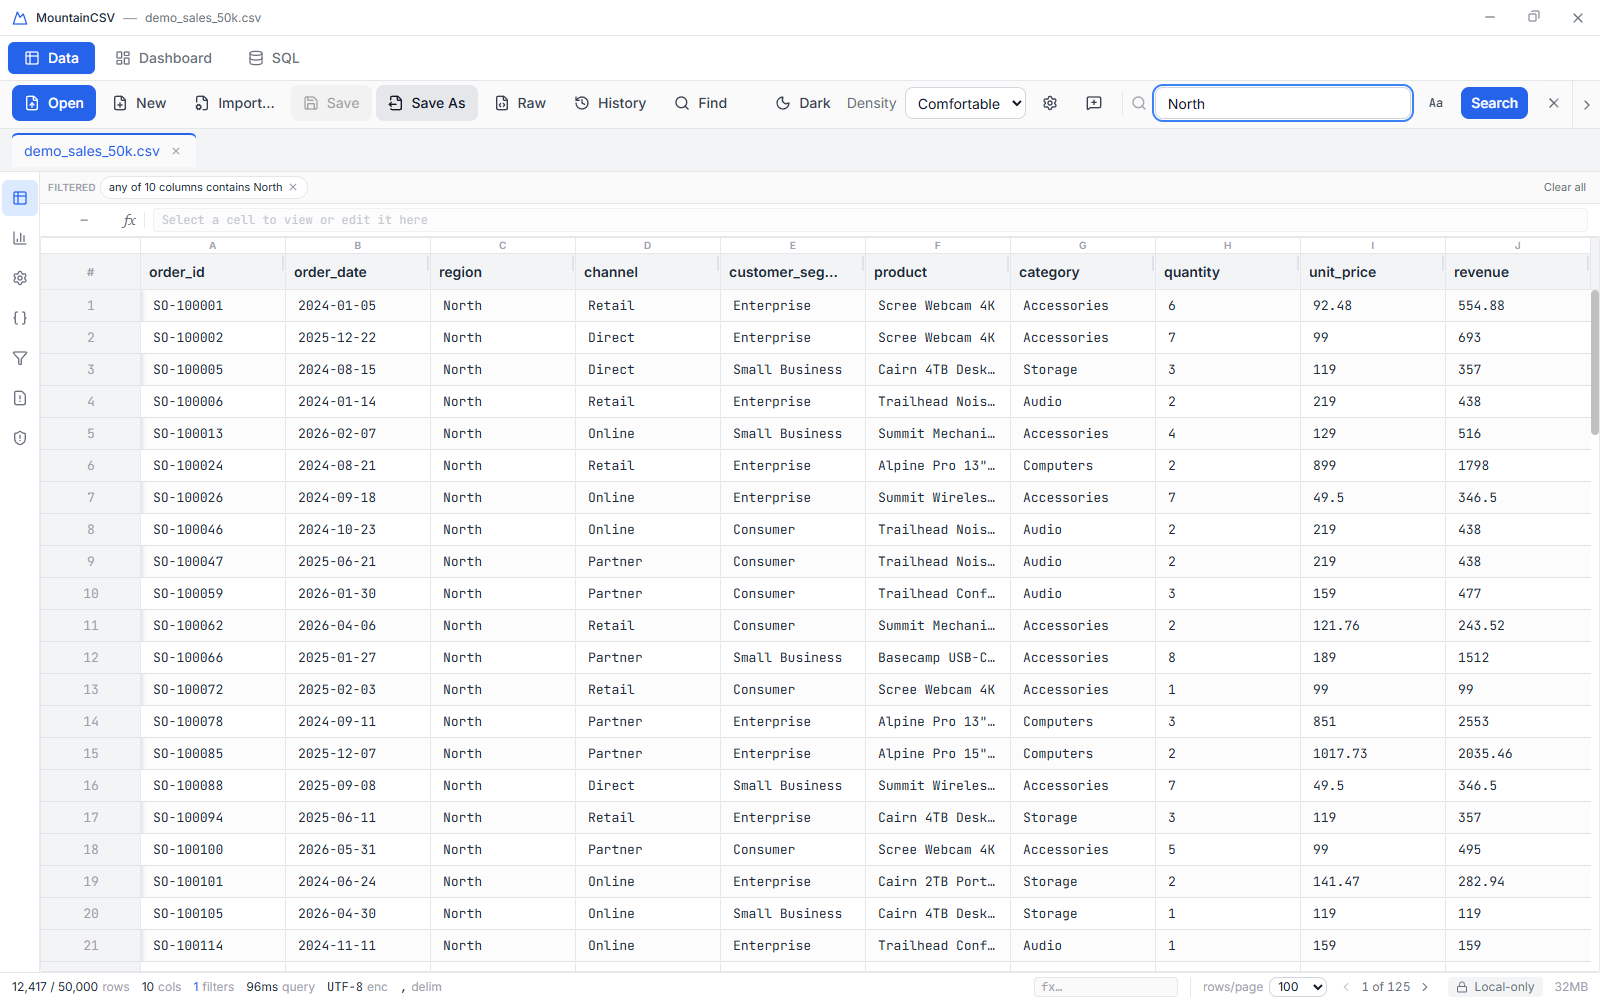
The chip bar means a filtered grid is never a mystery — and is always one click from being undone.
Row bookmarks
Mark the rows you're investigating and come back to them. Right-click a row (or a multi-row selection) and choose Bookmark — bookmarked rows get an accent stripe on their left edge, and a ★ count appears in the status bar.
- Click the ★ chip to filter the grid to bookmarked rows only; click it again to show everything.
- Bookmarks follow the row, not its position — they survive sorting and filtering.
- They're a per-file working set for the current session: right-click a bookmarked row to remove its mark, and closing the tab clears them.
Selection & copying
- Click a row to select it; Ctrl+click or Shift+click to select more.
- Selecting numeric cells shows live Σ (sum) / avg / n / min / max figures in the status bar — a quick check without leaving the grid.
- Press Ctrl+C to copy the selected rows as tab-separated text with a header row, ready to paste into a spreadsheet.
- Right-click and choose Copy N row(s) without header if you want the values alone.
Pagination & Go to row
Large files are paged on the backend — only the current page's rows are ever fetched, so a multi-million-row file stays responsive.
So a SUM in the formula bar, a histogram, or a
GROUP BY in the SQL workspace covers all
10 million rows even though you are looking at 100 of them. If you want the whole answer
rather than the visible slice, that is already what you are getting — and SQL is the way
to ask anything the built-in tools do not cover.
- Use the rows/page dropdown in the status bar to choose a page size (50, 100, 250, 500 or 1000).
- Use the ◀ / ▶ arrows to move between pages; the counter between them shows where you are.
- Type a row number into the Row # box on the toolbar and press Enter (or click Go) to jump straight to it, even if it is on another page.
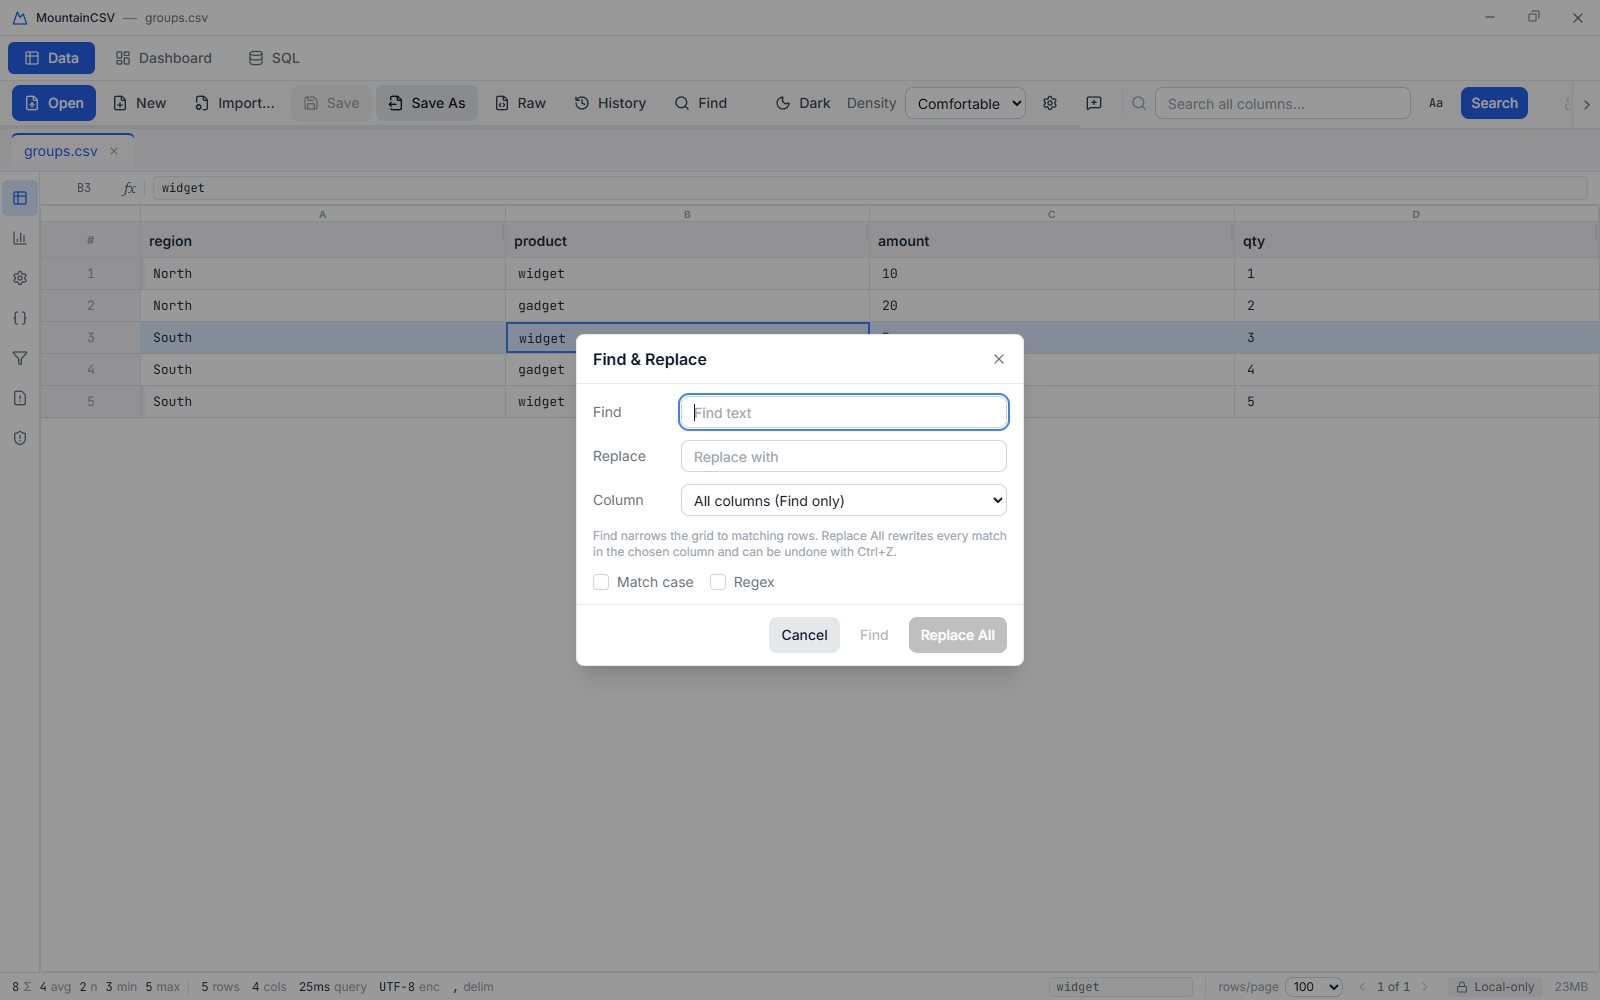
Find & Replace
- Click Find & Replace on the toolbar.
- Type the text to Find and its Replace text, then choose the Column to rewrite.
- Tick Match case for a case-sensitive search, or Regex to
treat Find as a regular expression — Replace then supports
\1backreferences. - Leave Replace empty to delete every match rather than swap it for other text.
- Click Replace All — every match in that column is rewritten in one undoable step. Find on its own just highlights matches in the grid without changing anything.
Merge Columns
- Click Merge on the toolbar.
- Tick two or more columns. A small number beside each shows the order they'll be joined in — that's the order you ticked them.
- Set the Separator (a space by default) and a name for the New column, then click Merge.
- Empty values are skipped rather than leaving stray separators, and the source columns are left alone.
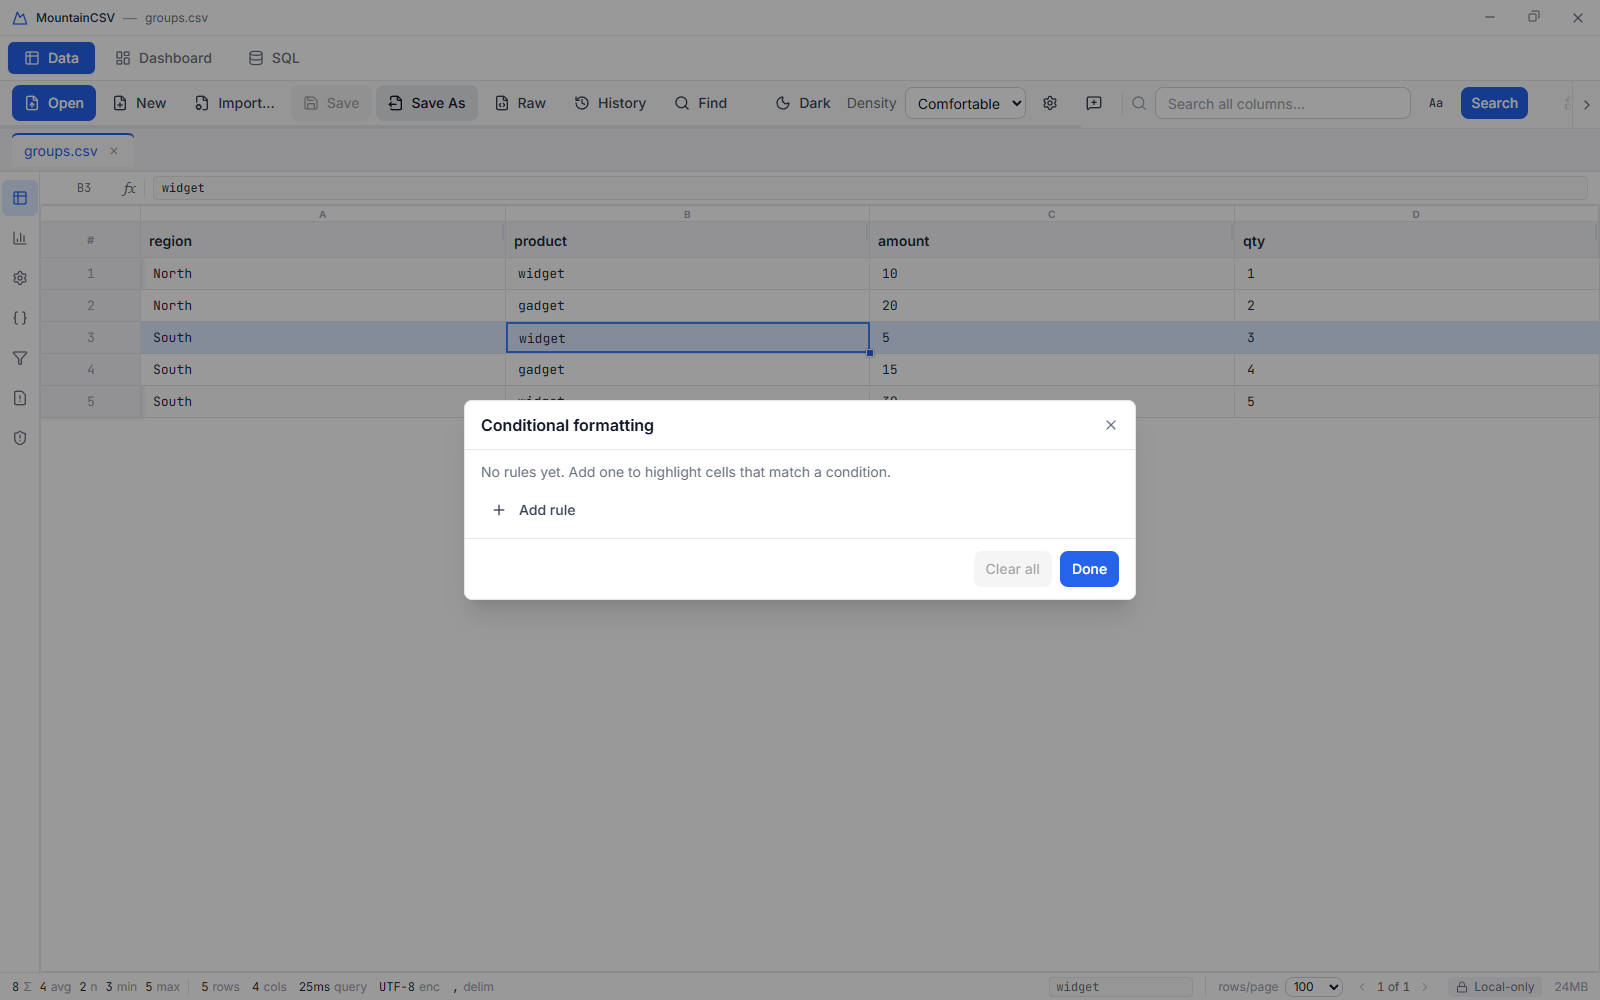
Conditional formatting
Highlight cells that match a rule — scores below 70 in red, say — without changing the underlying data.
- Click Format on the toolbar, then Add rule.
- Choose the column, an operator (
>,<,=,≠, contains, starts with, is empty, is not empty), a comparison value, and a colour swatch. - Add as many rules as you need — they apply live. Use the bin icon to drop one rule, or Clear all to remove them all, then Done.
- The Format button stays highlighted while any rule is active.
Export, Save & Save As
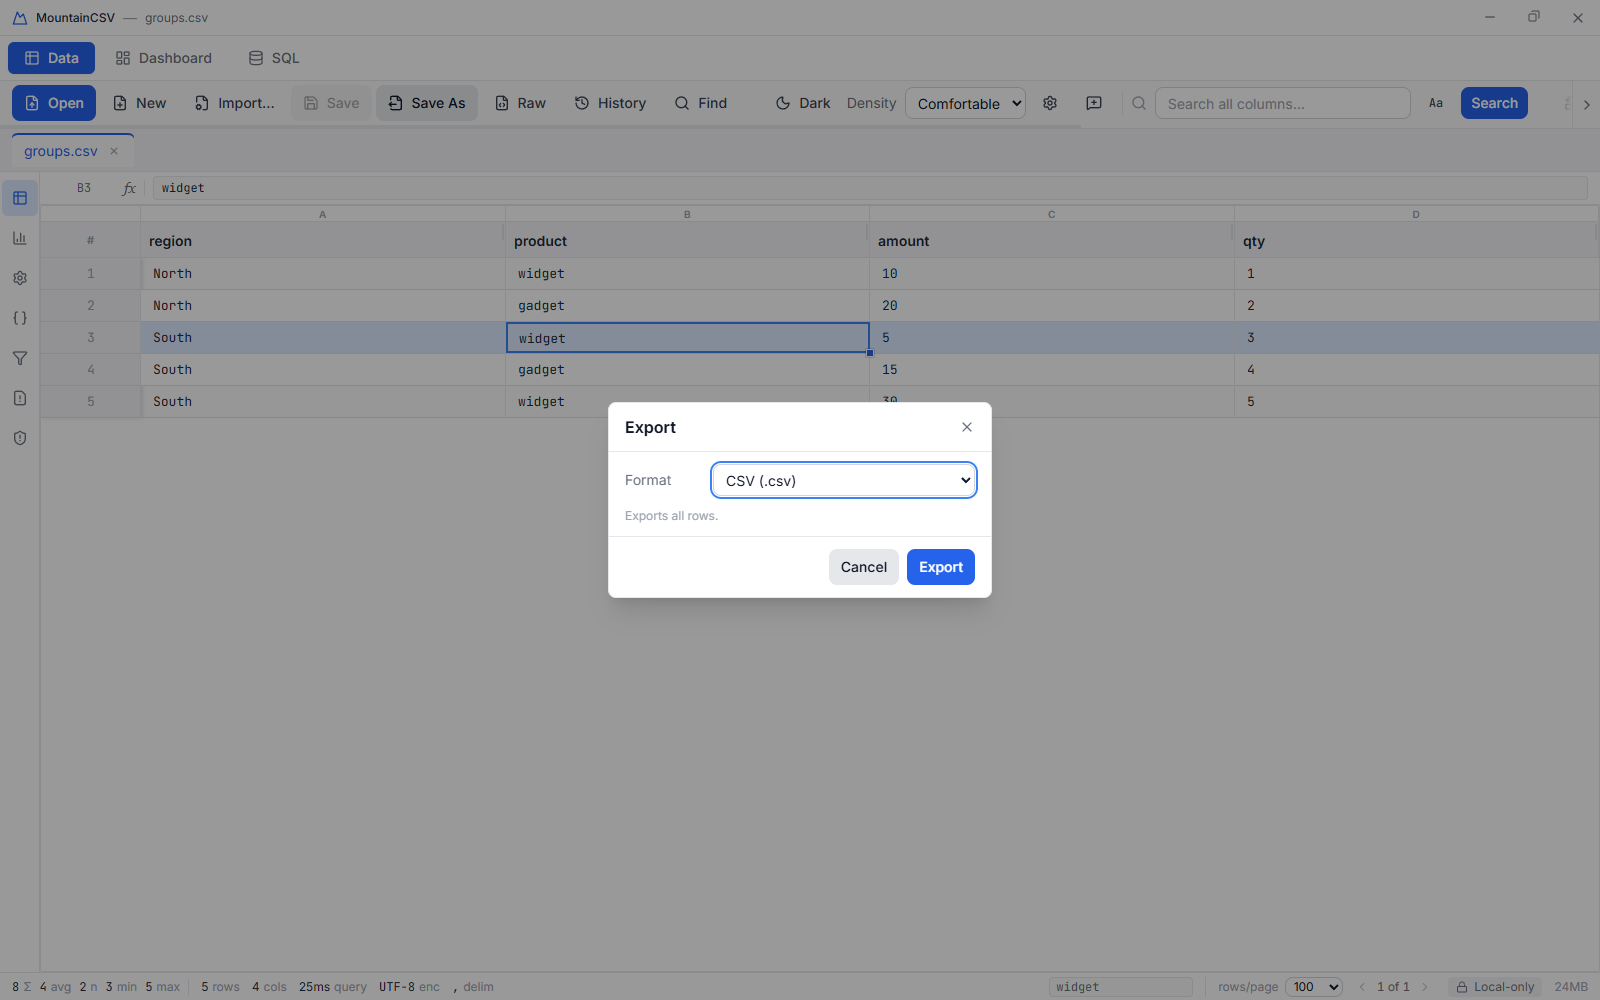
- Click Export and choose a format: CSV, TSV, JSON or Parquet, then pick a destination in the native save dialog.
- Save writes the current tab back over the file you opened, as CSV, and clears its unsaved marker. Save As (also Ctrl+E) asks for a new path and leaves the original untouched.
- If Validation rules are configured and the file has errors, you're asked to confirm before the export goes ahead.
File history
Every time a save or export overwrites an existing file, MountainCSV snapshots the old version first — the last 10 versions per file are kept in the app's own data folder. It's a safety net, not version control.
- Click History on the Home toolbar (enabled when the active tab is a real file on disk).
- Each version shows its date, time and size. Click Restore to put one back.
- Restore snapshots the current file first, so a restore is itself restorable — you can't lose anything by trying.
Raw file view
Sometimes you need to see exactly what's in the file — byte for byte, before any parsing. Click Raw on the Home toolbar for a read-only view of the source file: line numbers, page through 200 lines at a time, jump to any line. It streams a window of the file, so it opens instantly on files of any size, and files with broken encodings display (odd bytes show as replacement characters) instead of erroring. Perfect for checking a line the grid rejected, or settling "is that really a tab or four spaces?"
Find in Files
Search a whole folder of data files without opening any of them. Click Find on the Home toolbar:
- Browse… to a directory (or paste a path), set the extensions to scan
(default
csv;tsv;txt), and enter a search term — plain text (case-insensitive) or a regex. - Every matching file is scanned in isolation, with live progress and a Cancel button. A file that can't be read is reported and skipped — it never stops the search.
- The results open as an ordinary tab — file, row, column, value — so you can sort, filter and export the matches like any other data. From there, open the file it points at and jump to the row.
Searches are capped at 500 files and 200 matches per file, and the summary tells you if anything was truncated.
Recipes record & replay
Record a sequence of cleaning steps once, then replay the same sequence on a different file — useful for a repeated monthly cleanup.
- Click Recipe on the toolbar, then Record. The button turns red while recording.
- Clean as normal — fill, replace, convert type, anonymize, split, rename, clean-up fixes. Each step is listed in the dialog as you go.
- Click Stop recording, then Save to write the recipe out as
a
.mcsv-recipe.jsonfile. - To reuse it, open a different file, click Recipe → Load, pick the saved recipe, then Apply to current tab. Every step runs again in order.
- Clear empties the current step list without touching your data.
Rows & columns
Right-click in the grid to reach every row and column operation. Right-clicking a data cell shows the row actions first, then that column's actions below. Right-clicking the row-number gutter shows the row actions only.
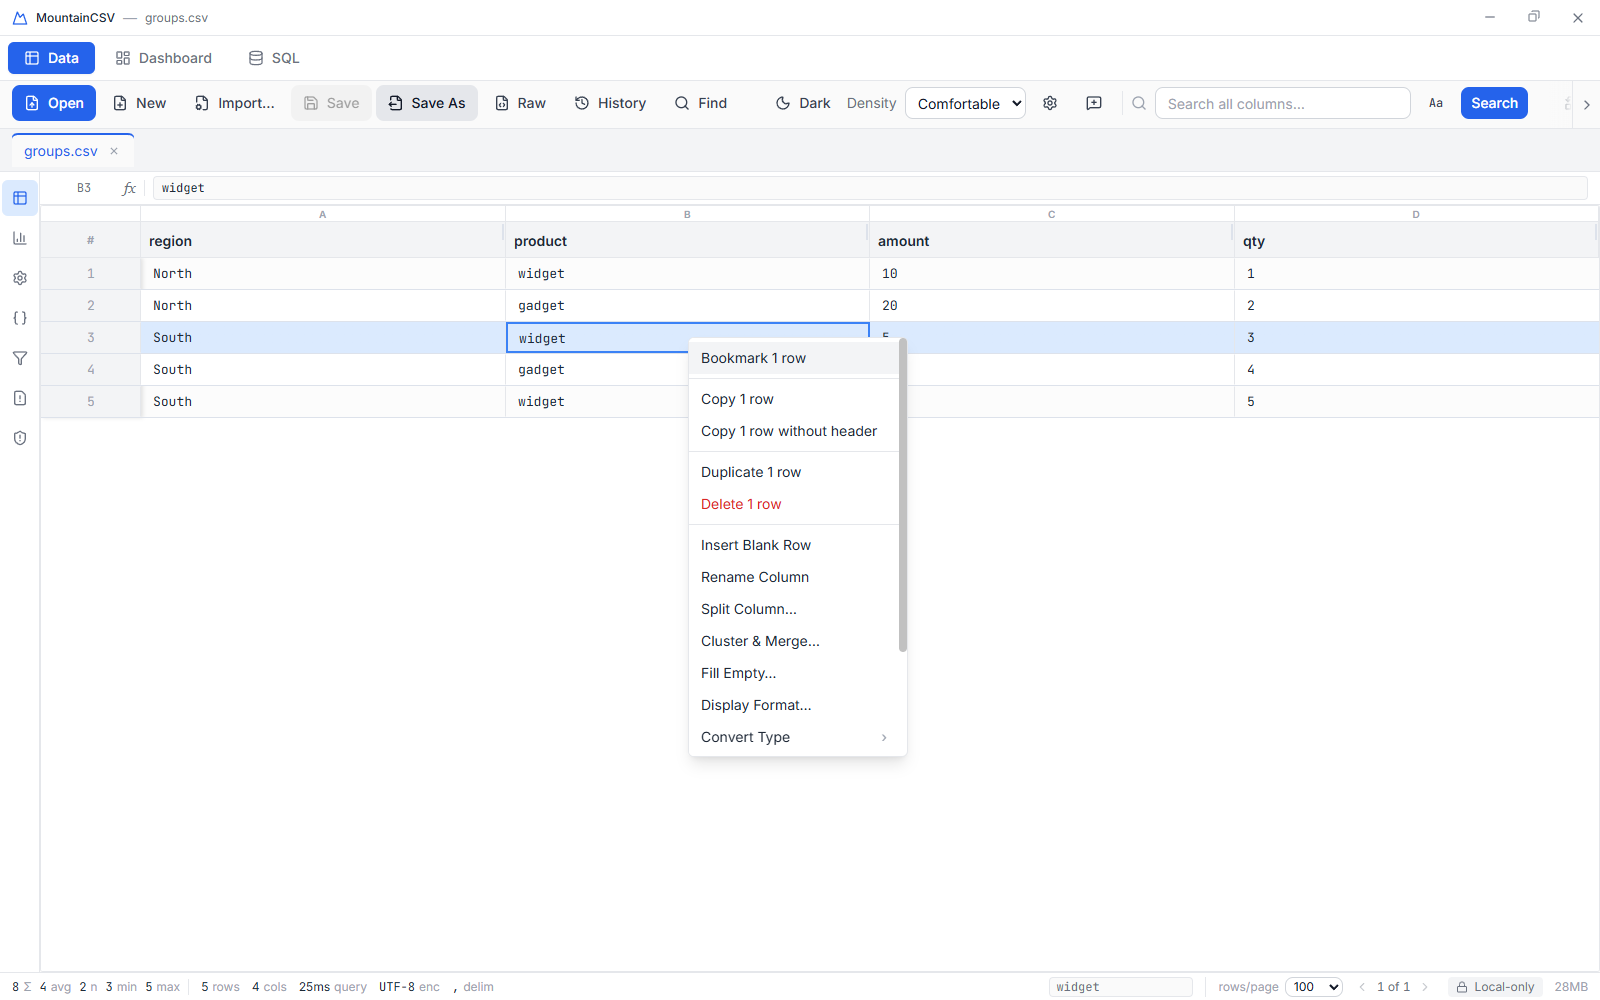
Row actions — copy, duplicate, delete, insert a blank row — with the column actions underneath.
Copy, insert, duplicate & delete rows
- Right-click a row (or a multi-row selection) and choose Copy N row(s), Copy N row(s) without header, Duplicate N row(s) or Delete N row(s).
- Insert Blank Row is always available and doesn't need a row selected — it adds one all-empty row.
- New rows, blank or duplicated, append at the very end of the file's row order. There's no "insert above row N": row order in the underlying table isn't something rows can be spliced into. If the new row lands beyond your current page, the grid jumps you there.
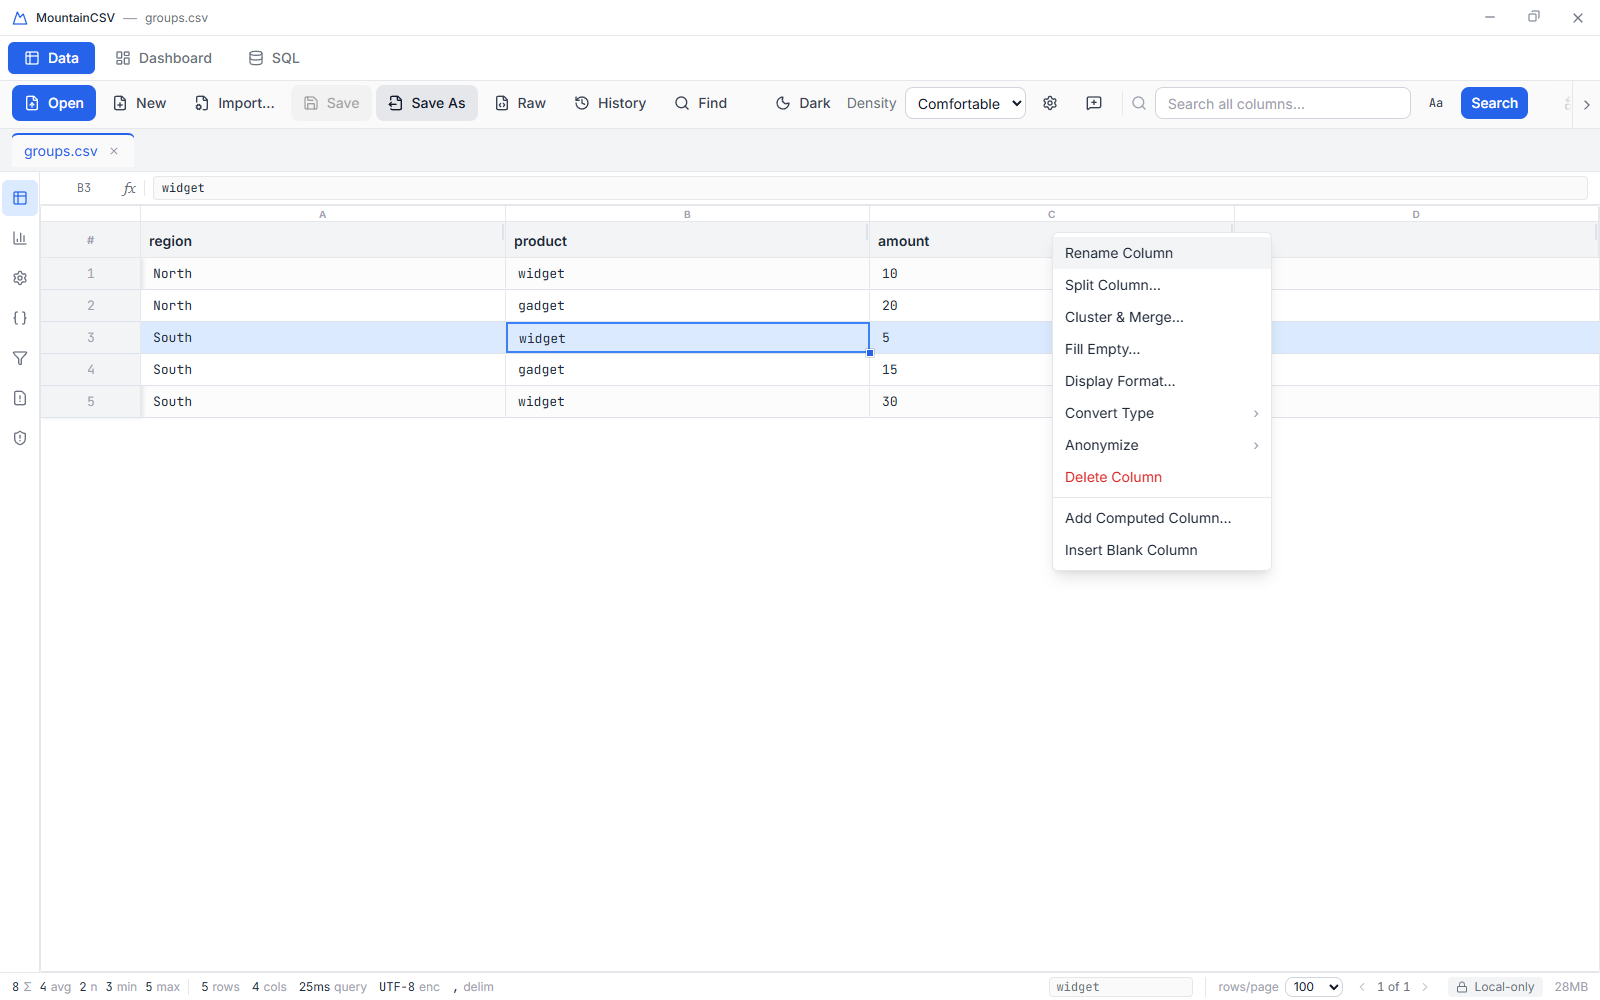
The column actions, reached by right-clicking a header.
Rename & delete a column Header right-click
- Right-click a column header, choose Rename Column, type the new name and confirm.
- Choose Delete Column to remove a column entirely. Like everything else, it's undoable.
Add Computed Column Header right-click
Create a new column from a SQL expression over the other columns — a formula that applies to the whole column at once, as opposed to in-cell formulas, which apply per cell.
- Right-click any column header and choose Add Computed Column….
- Give the new column a Name.
- Build the Expression. Click any of the column chips shown under the box to
insert that column's name at your cursor — no typing or misspelling, and names with spaces are
quoted for you. Type operators and functions around them, e.g.
price * quantityorUPPER(name). - Click Preview to see the first few computed rows. If the expression is invalid, the error appears here rather than after you commit.
- Click Add column.
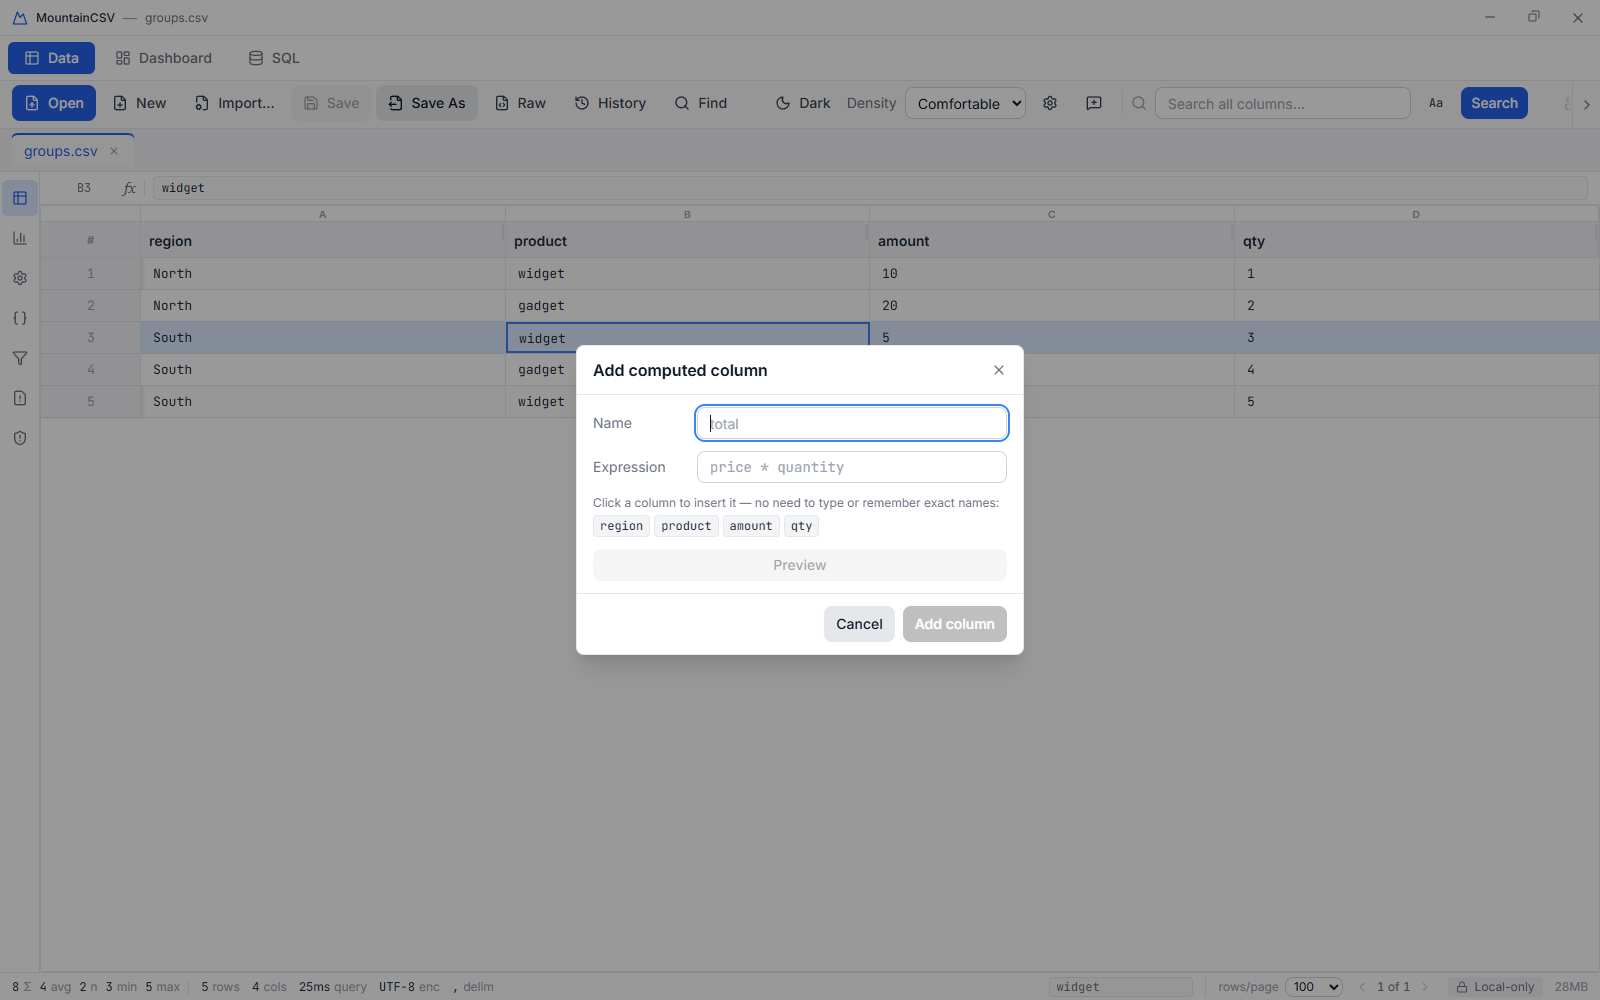
Click a chip to insert that column's name — never type or misspell a column name again.
Insert Blank Column Header right-click
Adds a genuinely empty column, auto-named "Column N" — no dialog, no expression. Useful when you just want somewhere to start typing values by hand.
- Right-click any column header and choose Insert Blank Column.
Split Column Header right-click
Break one column into several by a delimiter — for example splitting "Full Name" into a first and last name.
- Right-click the column and choose Split Column….
- MountainCSV samples the column's values and pre-fills the delimiter it detects (comma, semicolon, pipe, tab, slash or space) along with the number of columns needed to hold the most parts any value has, so nothing is silently truncated. Change either if the guess isn't what you want.
- Click Split. New columns named
<column>_1…<column>_Nare added and the original column is left in place.
"Jane Smith"), which can differ from the delimiter that separated the file's
columns. If a value has more parts than the number of columns you chose, the extras are dropped —
raise the count to keep them. The count can be between 2 and 20.
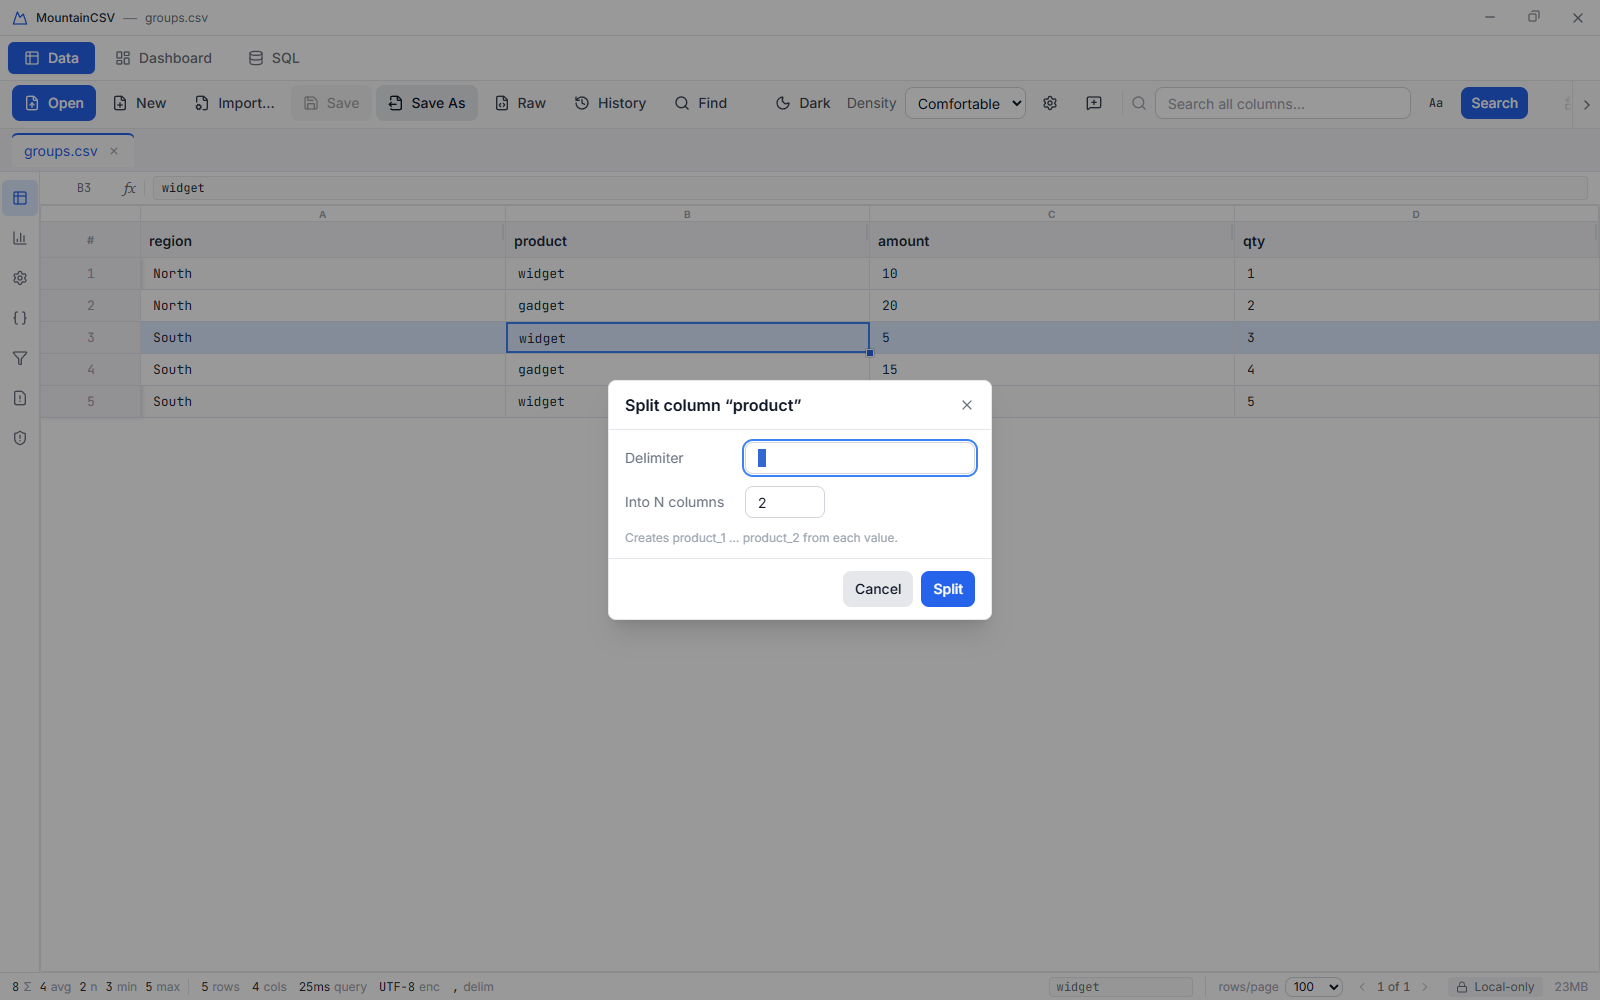
Cluster & Merge Header right-click
The fuzzy-dedup tool: it groups values that likely mean the same thing — "NYC" / "New York" / "new york" / "York, New" — so you can collapse them into one canonical value.
- Right-click the column and choose Cluster & Merge….
- Review the clusters it found. Each shows the variants it grouped together and the value it proposes keeping.
- Click Merge on a cluster to rewrite every member of it to that one value. Work through as many clusters as you like, then Close.
Fill Empty Header right-click
- Right-click the column and choose Fill Empty….
- Choose Fill down (value above), which carries the nearest value above into each gap below it, or Constant value, which types the same value into every empty cell.
- Confirm — only cells that were actually empty are touched.
Convert Type Header right-click
Change a column's underlying data type — turning text that looks like numbers into a real numeric column, so it sorts and aggregates correctly.
- Right-click the column, hover Convert Type and choose a target: Text, Integer, Decimal, Date, Timestamp or Boolean.
- Values that can't be converted become blank rather than causing an error, so check the column afterwards if you're not sure every value converted cleanly.
- Undo restores the original values and type exactly.
Anonymize Header right-click
Scrub sensitive values before sharing a file, entirely on your own machine.
- Right-click the column, hover Anonymize and choose a mode:
- Hash (MD5) — replaces each value with its MD5 hash. The same input always gives the same hash, so rows still match up across columns and files.
- Mask (keep last 4) — replaces everything but the final four characters with asterisks.
- Redact (***) — replaces every value with
***.
Display Format Header right-click
Changes how a column's values are shown — not the underlying data, which stays exact for sorting, filtering and export.
- Right-click a column header and choose Display Format….
- For Number: set decimal places, a thousands separator, and a prefix or suffix
such as
£or%. - For Text: display as UPPERCASE, lowercase or Title Case.
- Click Apply, or Clear format to go back to raw values.
Panels (left rail)
The narrow rail down the left of the Data workspace holds five buttons: Grid only, Column profile, Columns, Filters and Validation. Choosing one opens that panel to the right of the grid; Grid only closes it again. Drag the panel's left edge to resize it, or use the maximise button in its header to expand it over the whole window.
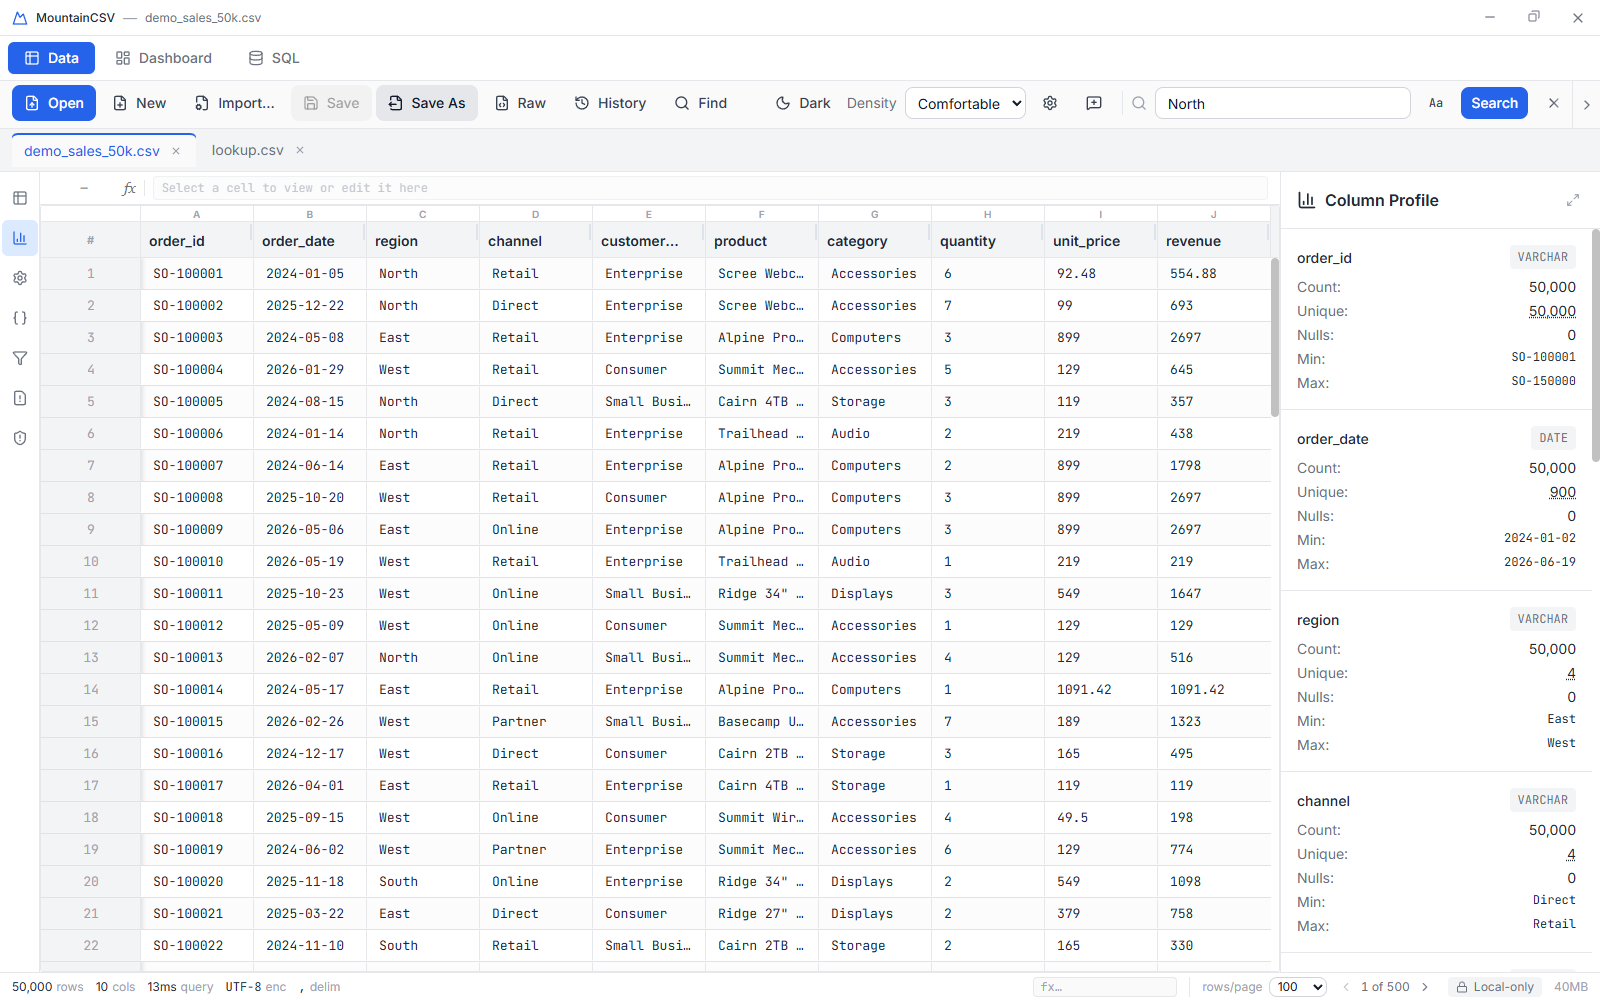
Column profile Left rail
Per-column statistics computed from the actual data: data type, count, unique count, null count, min and max, and for numeric columns the mean, standard deviation and P5 / P25 / P50 / P75 / P95 percentiles.
- Click the bar-chart icon in the left rail.
- Scroll to the column you're interested in. Null counts above zero are highlighted.
- Click a column's Unique figure to open the value explorer: every distinct value with its count, its share of all rows and a running cumulative percentage.
- Click any value in that list to filter the grid to just that value.
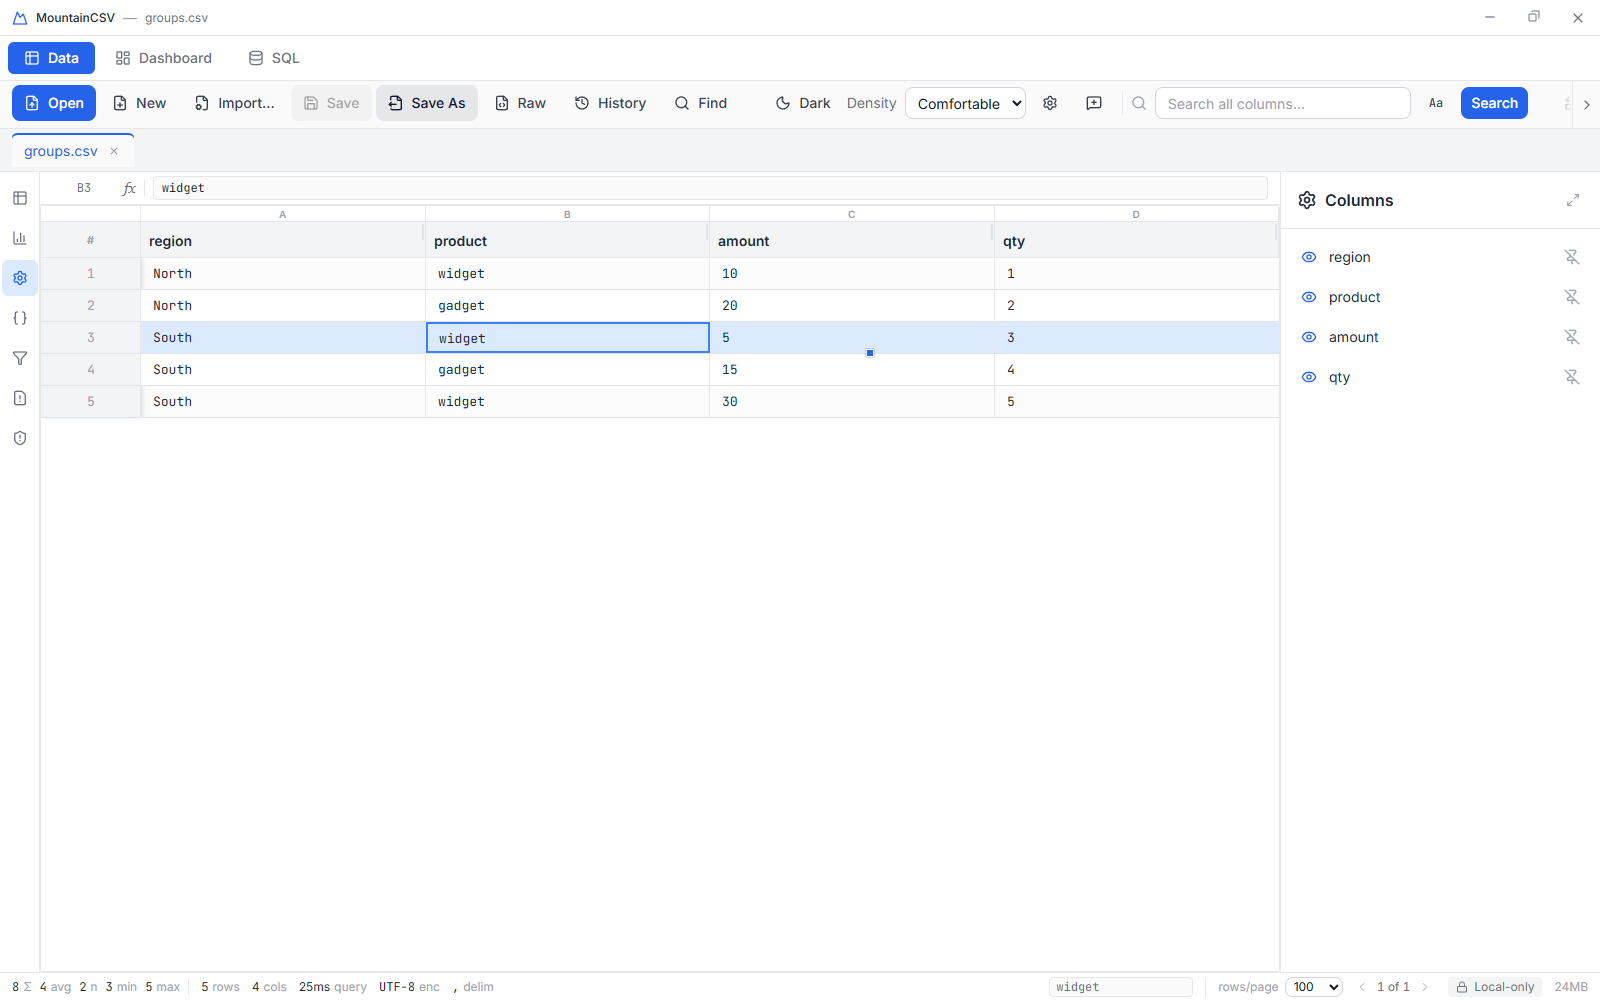
Columns Left rail
- Click the gear icon in the left rail.
- Click the eye icon beside a column to hide it. Hidden columns disappear from the grid but stay in the file, and are shown struck through in the list.
- Click the pin icon to pin a column to the left of the grid, so it stays visible while you scroll horizontally through a wide file.
Structure (nested data)
JSON and XML files often contain nested objects — a customer with an
address inside it. MountainCSV imports them as structured columns, and the
{ } icon on the left rail shows you the map: every column as a tree, with
nested fields expanded and typed.
- Open a JSON/XML file and click the { } Structure icon.
- Expand a structured column to see its fields, nested as deep as they go.
- Hover any nested field and click Flatten — a new column appears in the
grid named by its path (
customer.address.city) with that field's values. - Flatten is an ordinary computed column under the hood: it's undoable (Ctrl/⌘+Z) and recorded in the recipe like any other step.
Flat files simply say so — the panel lights up when there's nesting to explore.
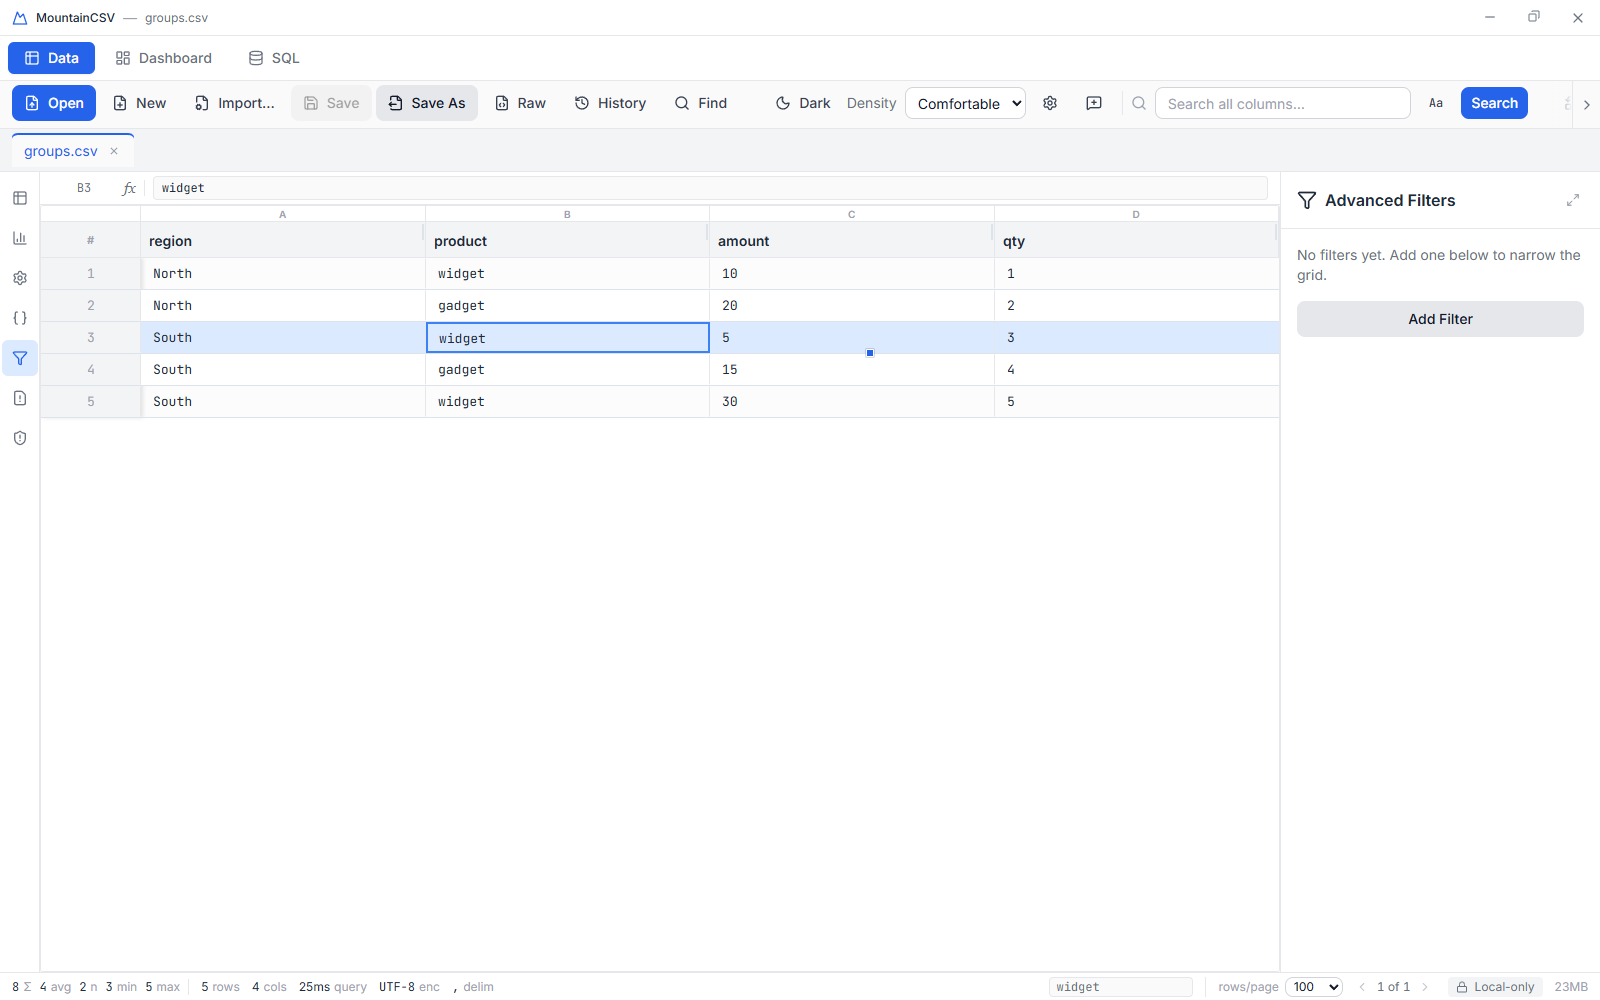
Filters Left rail
Build multi-condition filters that go beyond what a single column's menu can express.
- Click the funnel icon in the left rail.
- Click Add Filter, then pick a column, an operator and a value. Operators cover contains / not contains, equals / not equals, starts with, ends with, the four numeric comparisons, regex, and is null / is not null.
- Add more rows and set each one's AND / OR joiner.
- Click Apply Filters — nothing changes in the grid until you do.
- Use Remove on a row to drop that condition, or clear everything from the filter chips above the grid.
Validation & clean up Left rail
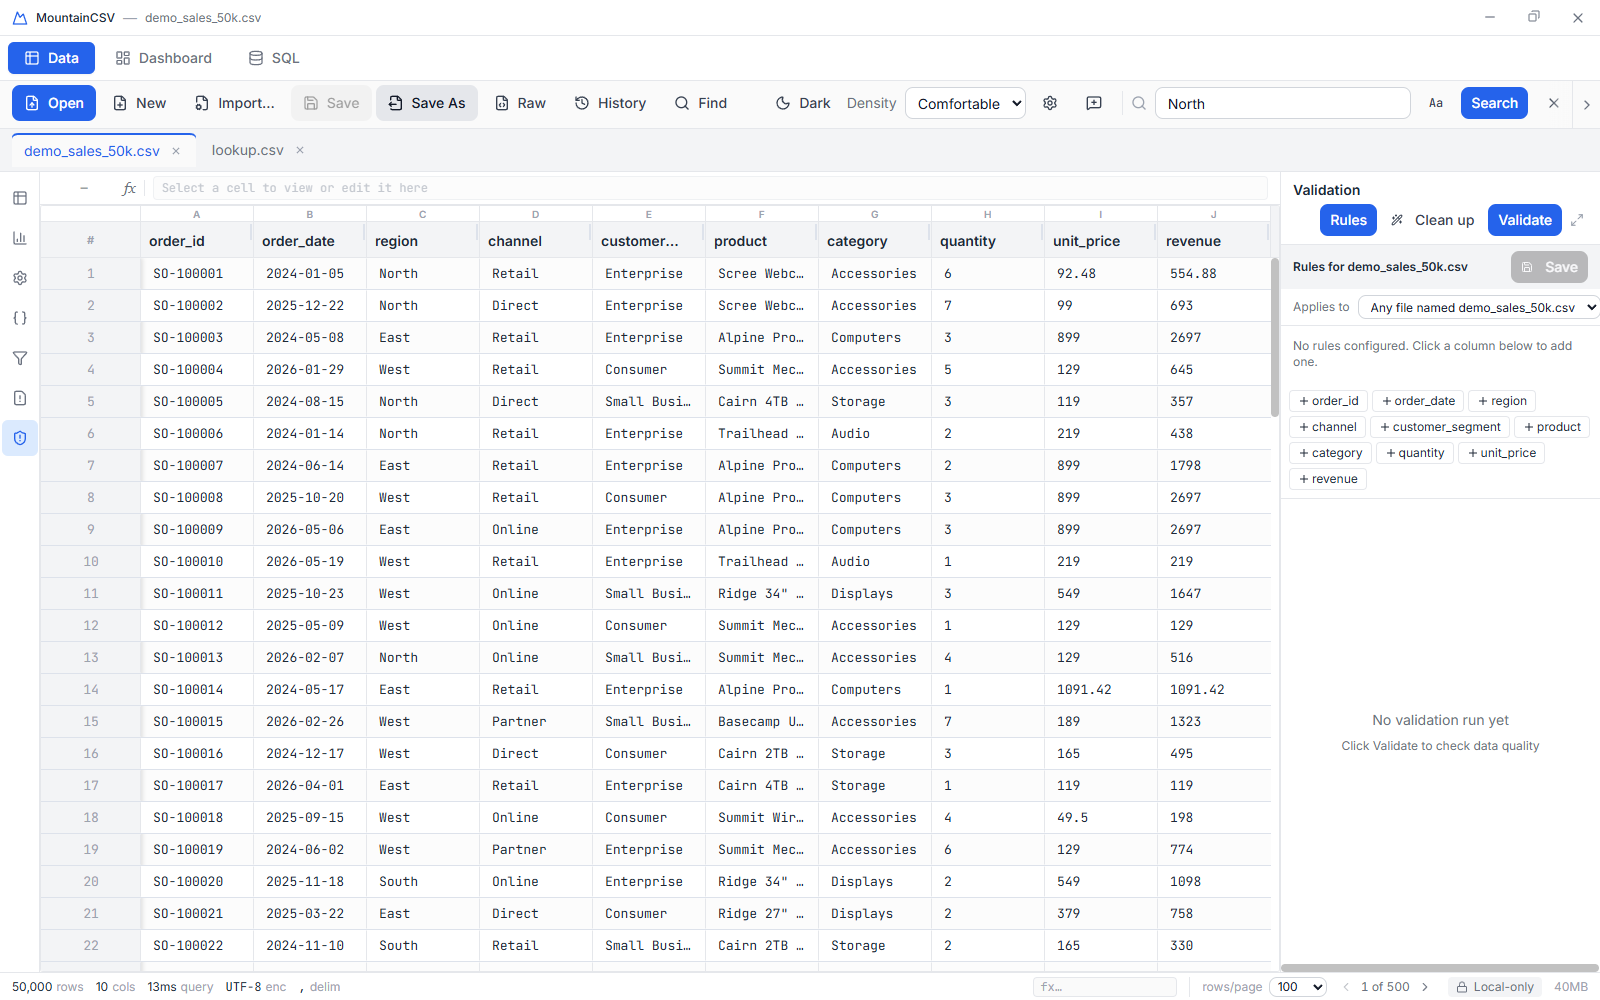
Define quality rules per column, run them against the whole file, and fix common problems with one click. Rules are saved per file name, so reopening the same file brings them back.
- Click the shield icon in the left rail.
- Under Rules, click a column chip to add a rule to it. Pick a rule type — Text, Integer, Decimal, Date, Email, URL, Regex, Required only, Unique, or One of (list) — and a severity of Error or Warning. Integer and Decimal rules take a min and max; Date takes a format plus optional bounds; Regex takes a pattern; One of takes a list of allowed values. Every rule can additionally be marked Required and Unique.
- Click Save to keep the rules for this file.
- Click Validate to run them. You get exact error and warning counts, issues grouped per column, and failing rows highlighted in the grid itself. Click an issue to jump to its row, or use Show invalid only to filter the grid down to the failing rows.
- Open Clean up for one-click fixes on a column: trim whitespace, UPPERCASE,
lowercase, Title Case, normalise a number (strip commas and spaces), strip emoji, or normalise a
date to
YYYY-MM-DDfrom a format you specify. - Click Preview to see the exact before → after for the rows that would change. Apply fix only becomes available once you have — so a bulk rewrite is never a leap of faith.
SQL workspace
Click SQL in the top bar. Every reshaping and multi-file tool lives here alongside the editor, and every one of them opens its result as a brand-new tab in the data panel on the right, leaving your original file untouched.
Layout & the sources tree
- Across the top: the reshape tools — Join, Union, Compare, Aggregate, Pivot, Correlate, Unpivot and Sample.
- Down the left: the sources tree, in two sections. Files lists every open file exposed as a queryable table — expand one with the arrow to see its columns. Databases holds any attached database, with its schemas, tables and columns fetched lazily as you expand them.
- Click a table name to insert it into the editor — or, if the editor is empty, to write
SELECT * FROM <table>for you. Click a column name to insert that at your cursor. - Below the tree, History lists the queries you've run. Click one to load it back into the editor.
- On the right: your data, with its own tab bar, formula bar and filter chips. Drag its left edge to make it wider or narrower.
Writing & running a query
- Open a file first — the editor is seeded with a
SELECT * FROM … LIMIT 100against it so you always have something that runs. - Write your query. The editor has syntax highlighting and schema-aware autocomplete: start typing a table or column name and suggestions appear.
- Press Ctrl+Enter (⌘+Enter on macOS) or click Run query.
- The result opens as a new tab in the data panel and is itself added to the sources tree, so you can query the result of a query.
- The Output panel beneath the editor reports what happened: how many rows came back and how long it took, or — if the query failed — the database's exact error message. That text stays put while you fix the query, and can be selected and copied.
Attaching a database
Connecting from the welcome screen copies a table in. Attaching is different: the database stays where it is, its tables become queryable alongside your open files, and nothing is read from it until a query actually runs.
- In the sources tree, next to the Databases header, click the plug icon — Attach a database.
- Fill in the connection using the same field-based form as the Connect dialog (driver, then TNS name, Host & port, saved DSN or a raw connection string) — or unlock your saved connections and load one with a click.
- Set the Name in SQL —
dbby default. That's the prefix you'll write in queries:db.SCHEMA.TABLE. - Click Attach. The connection appears under Databases with its schemas. Expand a schema to fetch its tables, and a table to fetch its columns — the tree loads lazily, so a schema you never open costs nothing, even on a database with thousands of tables.
- Click any table or column to insert its fully qualified name into the editor. The unplug icon on the header detaches the connection.
Federated queries — files and databases in one statement
With a database attached, a single SQL statement can read your open files and the
database's tables together — join this month's refunds CSV against the live
db.SALES.ORDERS table directly, with no export on one side or import on the
other.
- Write the query as if everything were local: files by their names from the
Files section, database tables by their qualified names —
SELECT … FROM refunds r JOIN db.SALES.ORDERS o ON o.id = r.order_id. - Run it as normal. The result opens as a new tab like any other query, and the Output panel reports the row count and timing.
- MountainCSV pushes work down to the database where it can: only the columns the query mentions, and only the rows that pass its filters, cross the connection — not whole tables.
Edit as SQL
The Aggregate, Join and Pivot dialogs each have an Edit as SQL button next to their Run button.
- Fill in the dialog as you normally would.
- Click Edit as SQL instead of running it. The dialog closes and the equivalent query — written against the same table names shown in the sources tree — appears in the editor.
- Read it, change it, then run it. It's the quickest way to see what a dialog actually does, and to go one step further than the dialog allows.
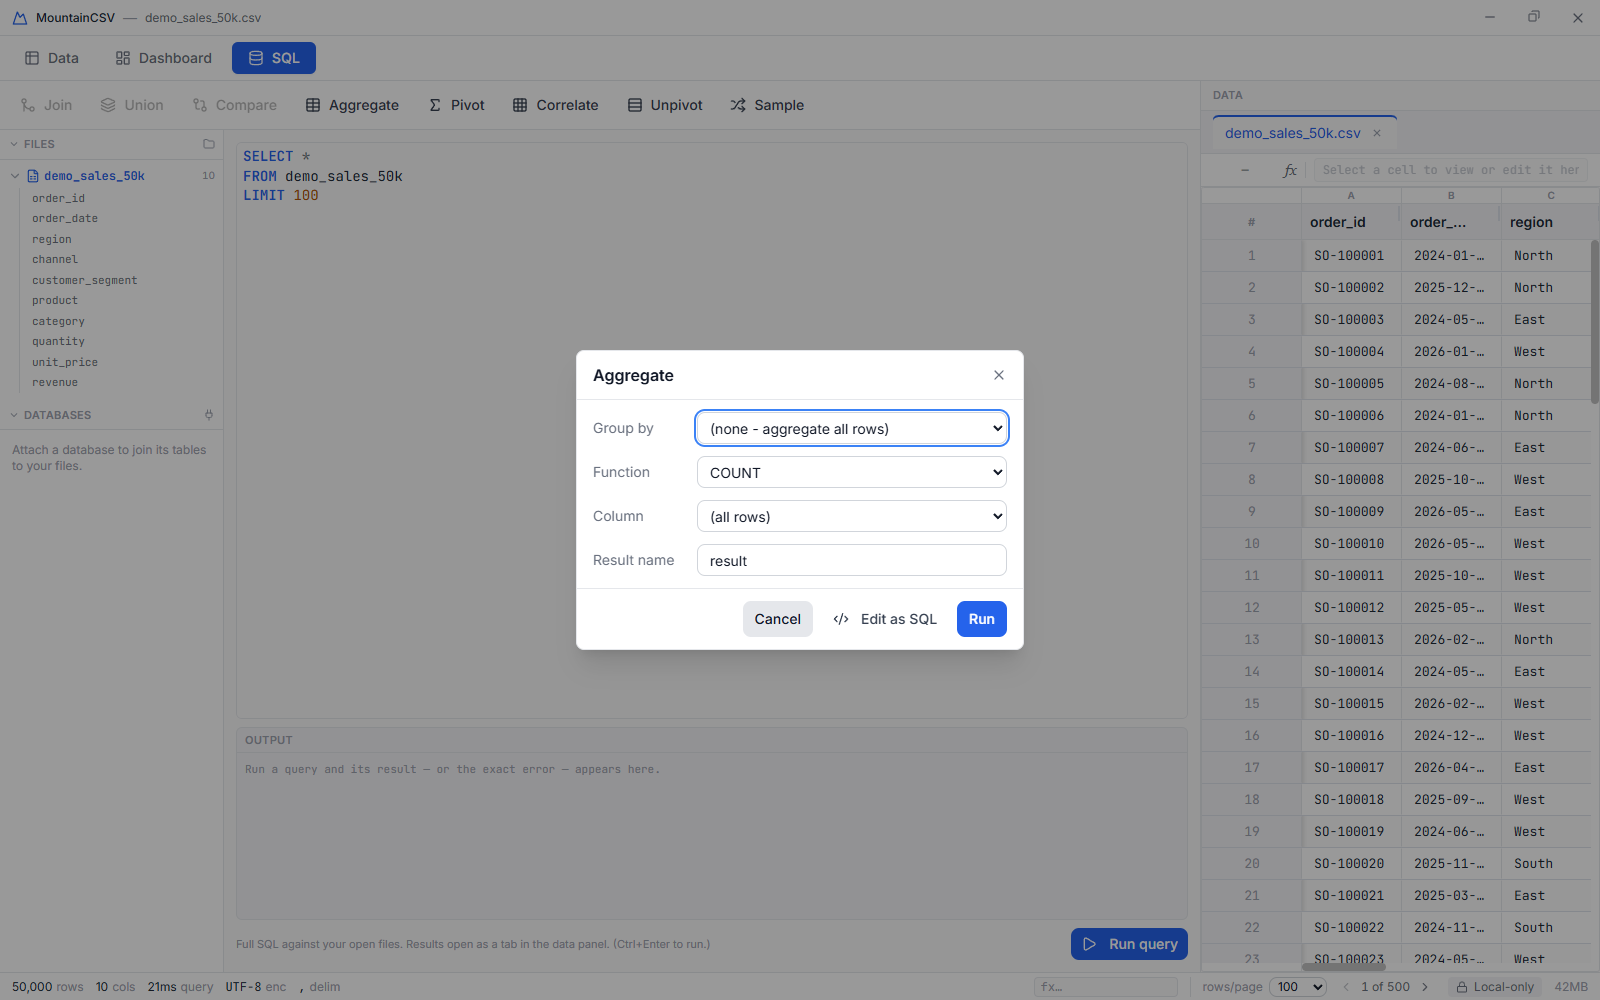
Aggregate
GROUP BY, without writing SQL.
- Click Aggregate.
- Choose a Group by column, or leave it as "(none — aggregate all rows)" for a single summary row.
- Choose a Function — COUNT, SUM, AVG, MIN or MAX — and, unless you chose COUNT, the Column to aggregate.
- Set the Result name for the computed column, then click Run. The grouped result opens as a new tab.
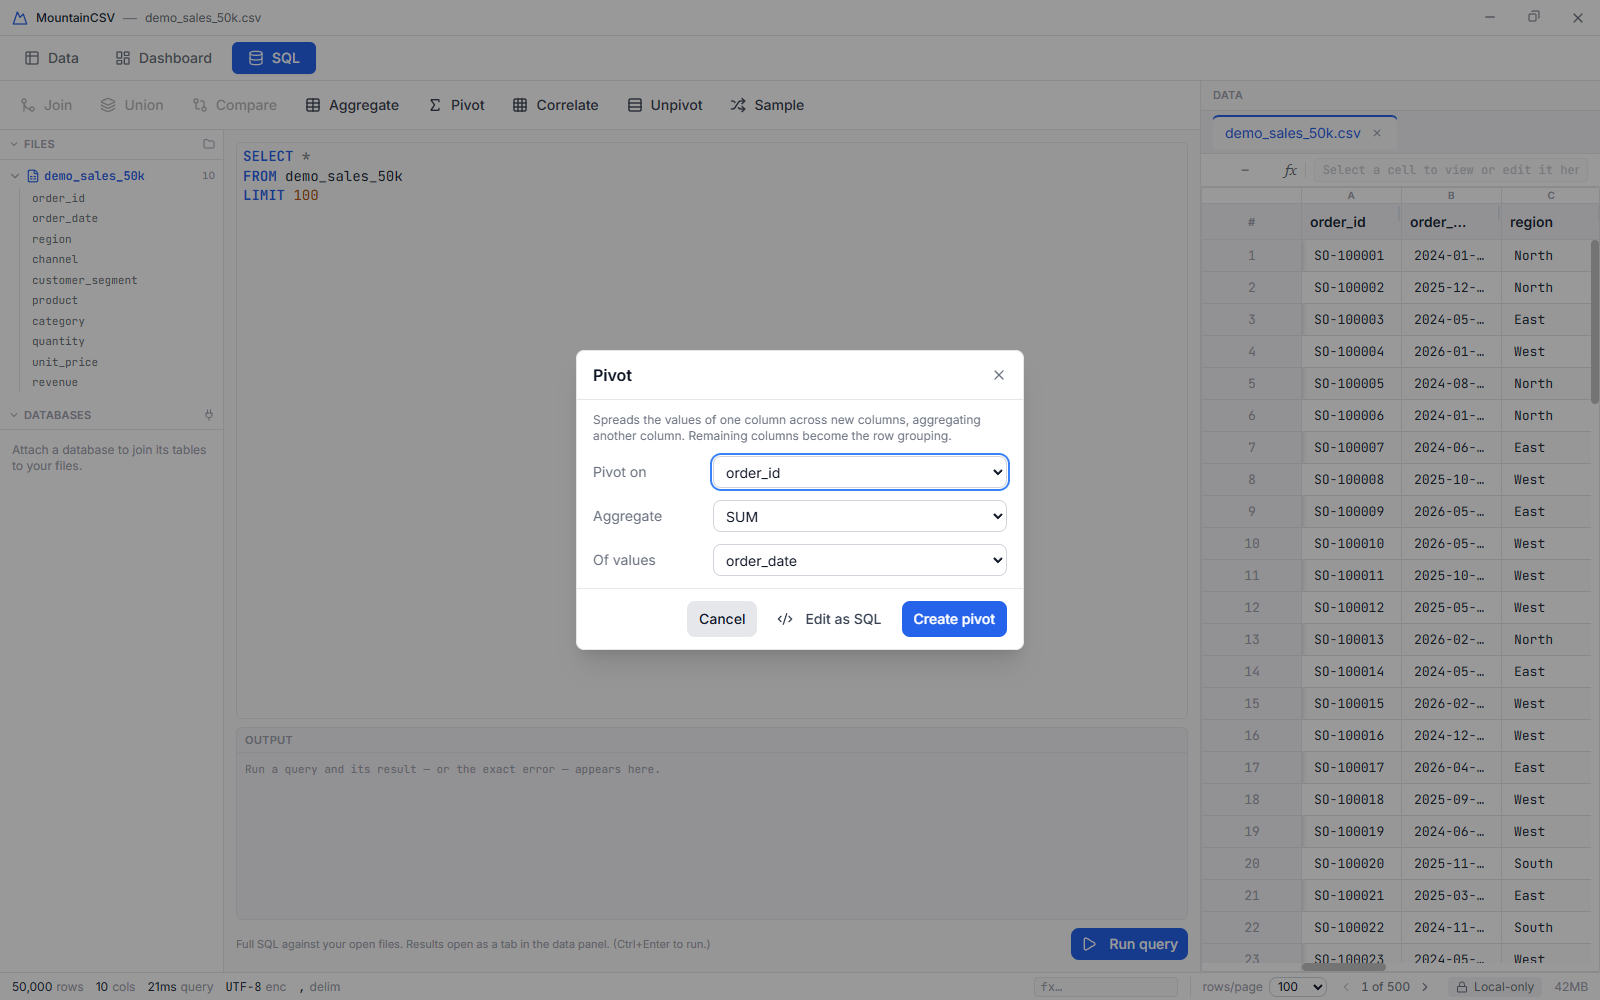
Pivot
Spreads one column's distinct values across new columns — turning long data wide.
- Click Pivot.
- Choose the column to Pivot on; its values become the new column headers.
- Choose an Aggregate function and the column Of values to fill them with. The remaining columns become the row grouping.
- Click Create pivot.
Unpivot
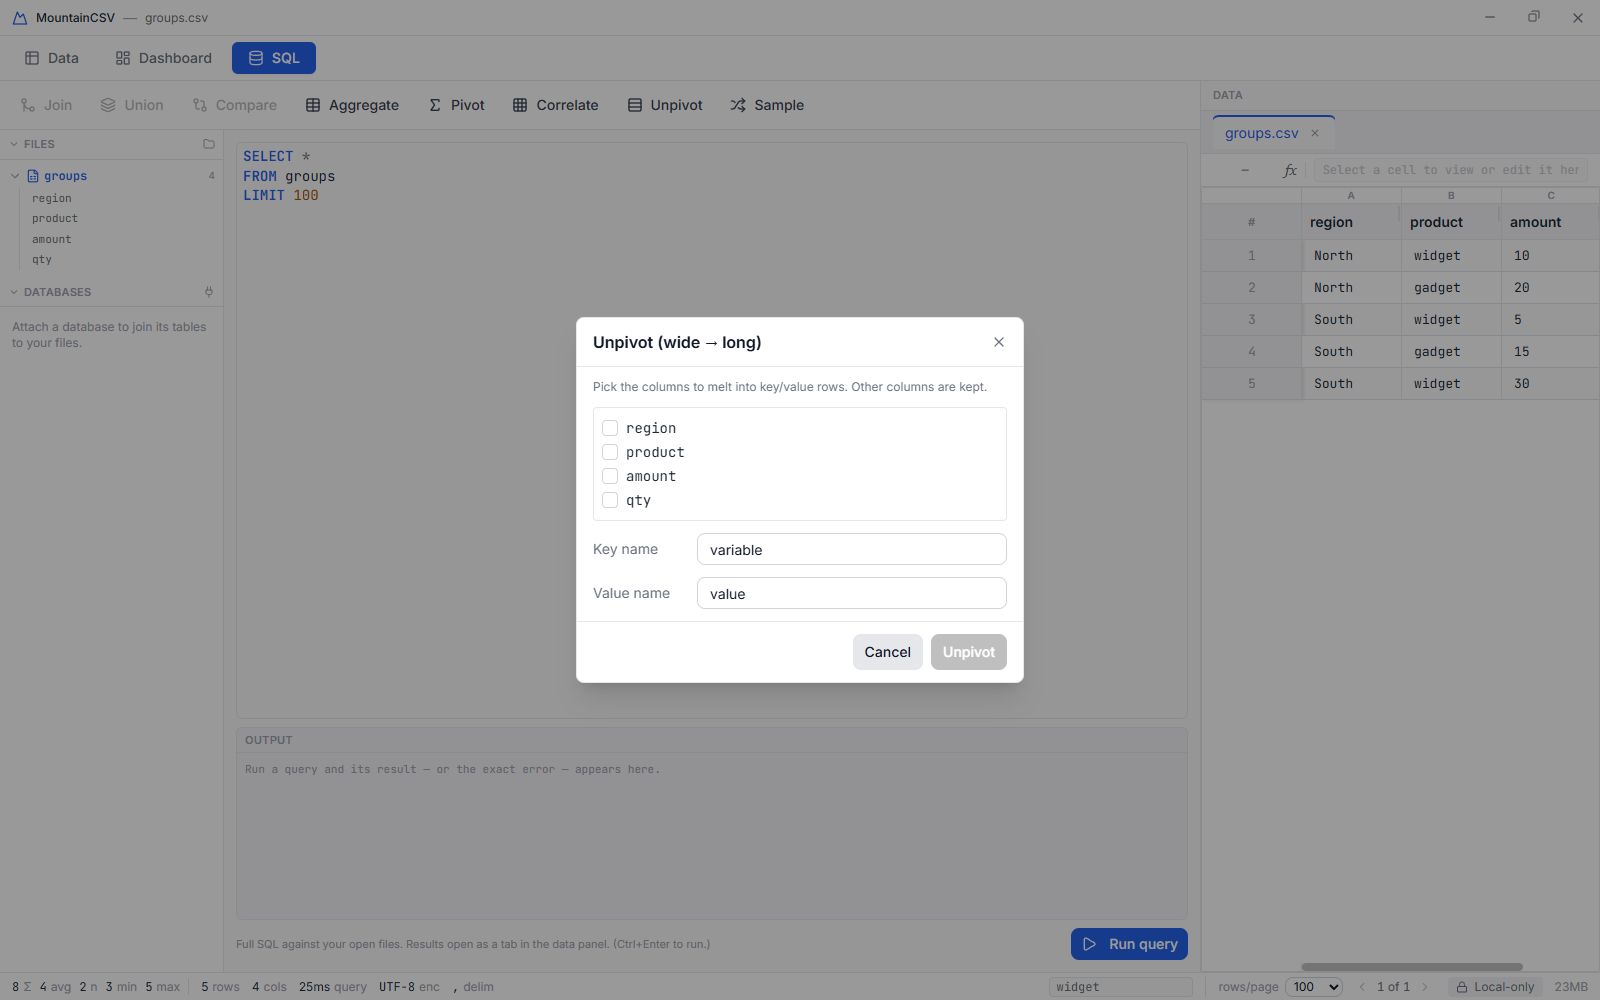
The reverse of Pivot — melts several wide columns back into tidy key/value rows.
- Click Unpivot.
- Tick the columns you want melted into rows — at least two. Columns you don't tick are kept as-is on every output row.
- Name the Key and Value columns the melted data will land in.
- Click Unpivot.
Join
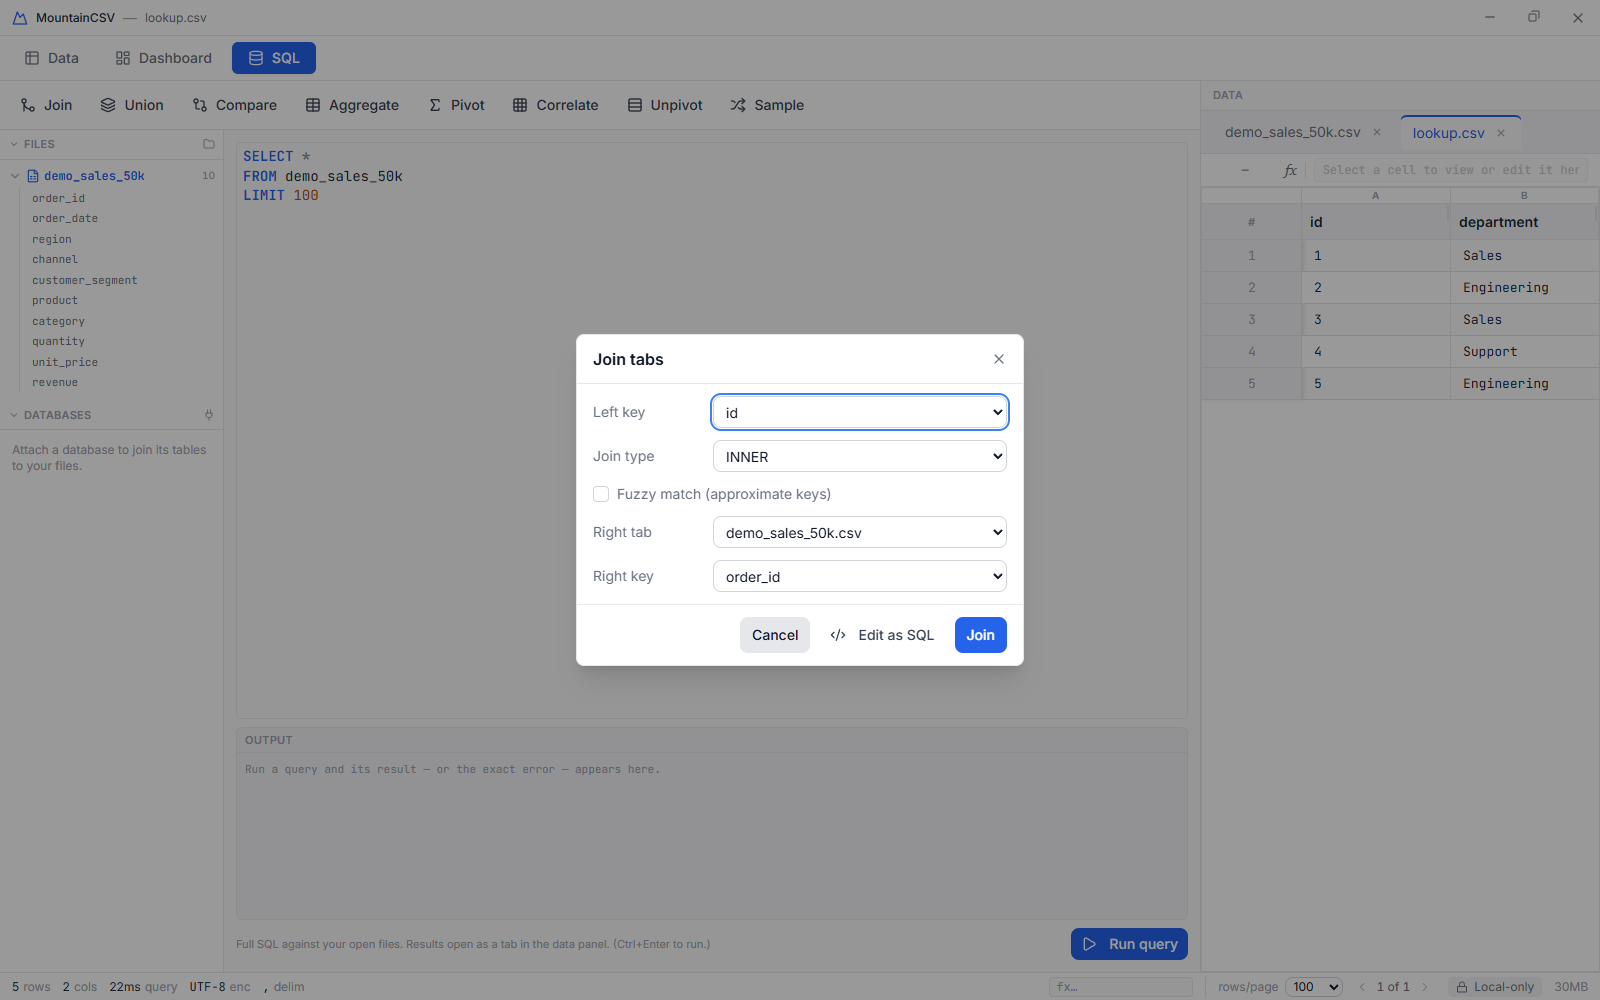
Combine two open files on a matching key column — like a spreadsheet lookup, but for whole tables.
- Open both files as tabs first; Join is disabled until there's a second tab to join against.
- Click Join. The current tab is the left side; pick the Right tab from the dropdown.
- Choose the Left key and Right key columns, and a Join type: INNER, LEFT, RIGHT or FULL.
- Click Join — the combined result opens as a new tab.
Union
Stacks every open tab into one combined tab.
- Open each file you want to combine as its own tab.
- Click Union. All open tabs are stacked and the result opens as a new tab.
Compare
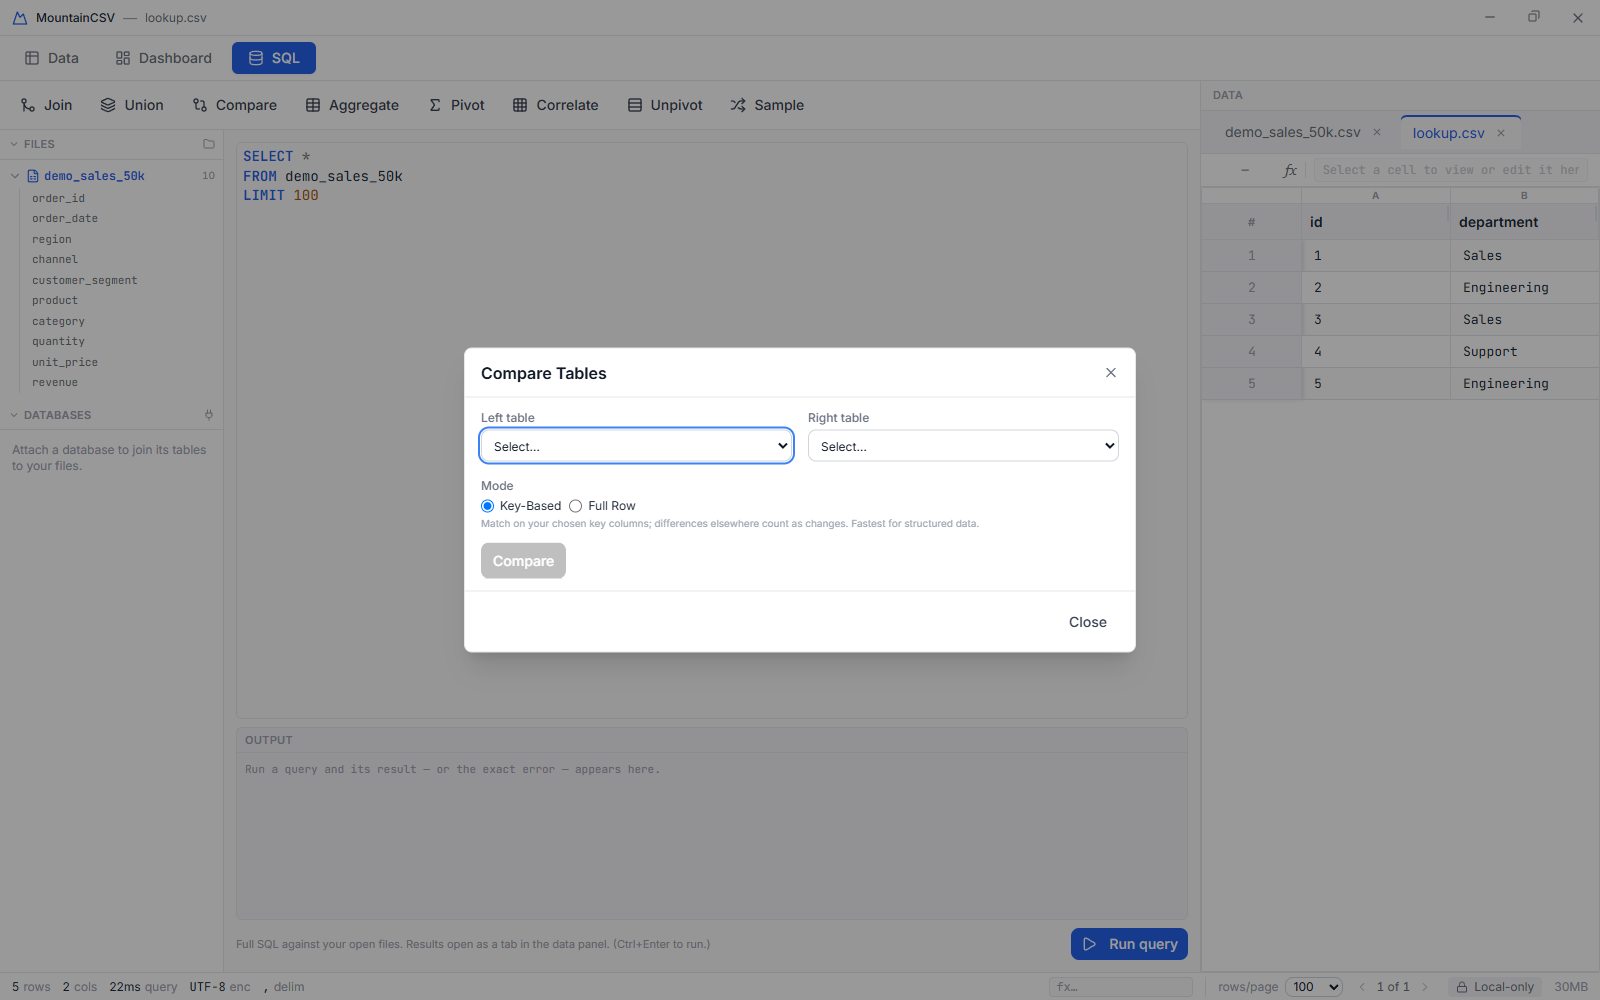
Reports exactly what changed between two versions of similar data — which rows were added, removed, or had a value change.
- Open both versions as tabs, then click Compare.
- Pick the Left table and Right table. Their row and column counts are shown so you can check you've got the right pair.
- Choose a Mode. Key-Based matches rows by the key columns you pick and reports differences in the other columns as changes — the fastest option for structured data. Full Row treats every shared column as part of the key, so rows are either identical or present on one side only.
- Click the column chips to choose your key columns, and use Exclude to ignore columns that always differ, such as a timestamp.
- Run it and read the summary: Only Left, Only Right, Changed and Identical counts, with the differing rows listed below.
Two other things it will tell you rather than let you guess: when the tables share no column names at all there is nothing to match on, so Compare is disabled; and when the only shared column is the key itself there is nothing left to compare, so every matched row is trivially "identical".
Correlate
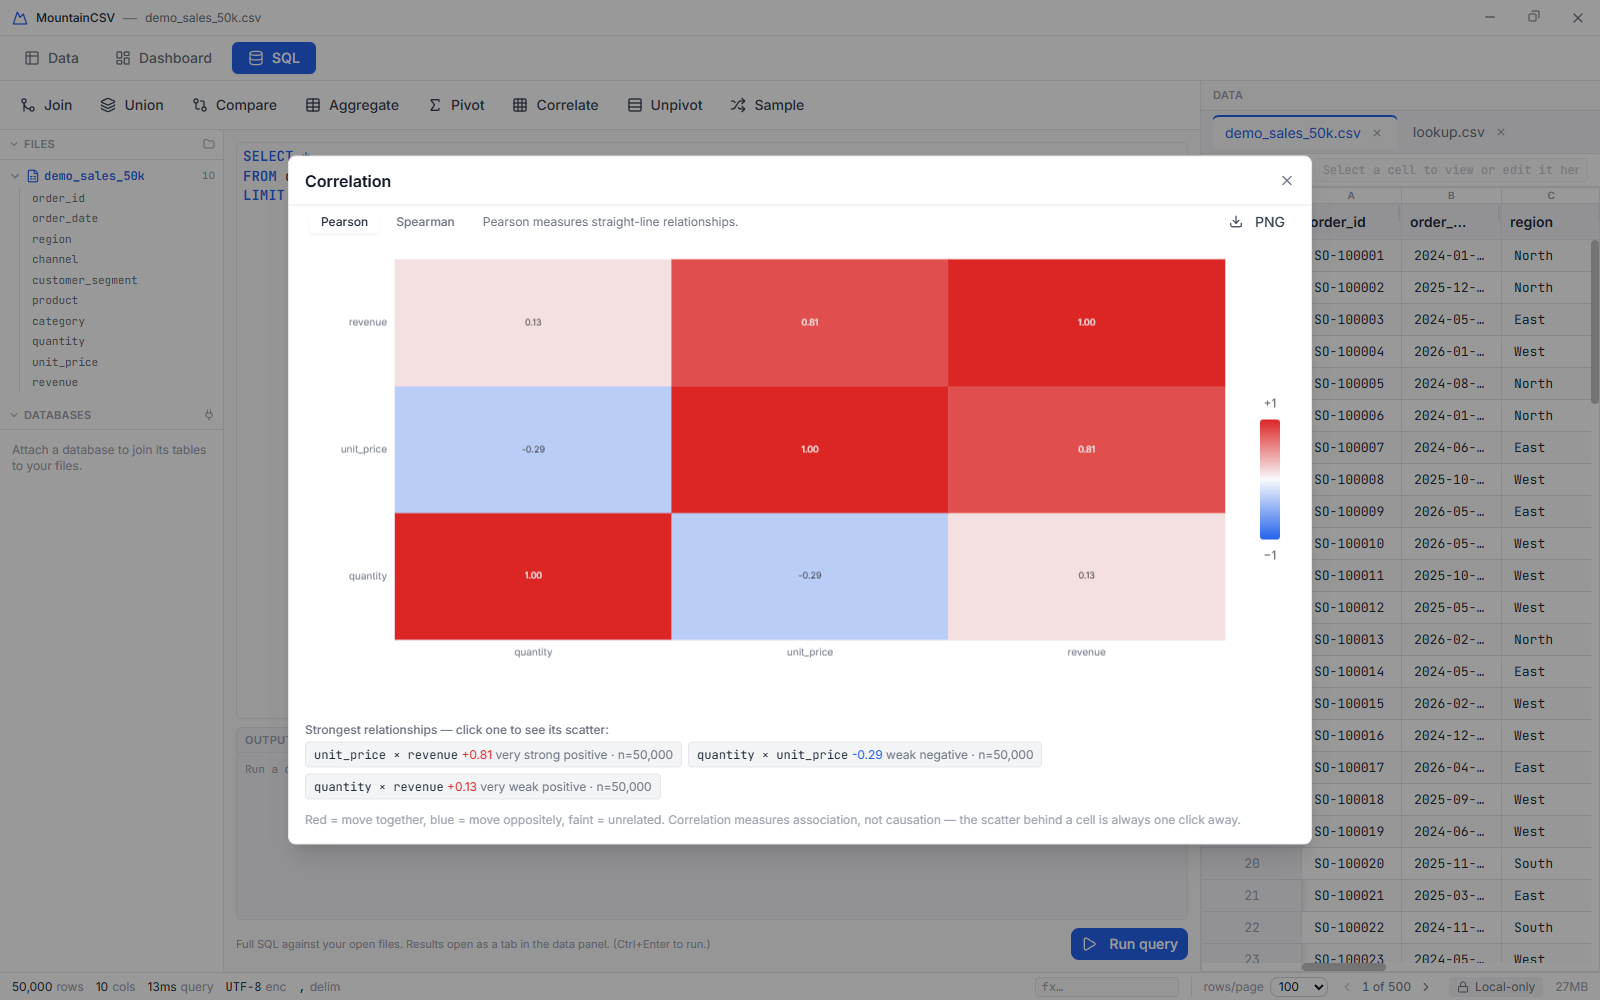
A correlation explorer across every numeric column — a heatmap of which columns move together, a plain-words list of the strongest relationships, and the scatter behind any cell one click away.
- Click Correlate. The heatmap computes automatically for the current tab: red cells move together, blue move oppositely, faint means unrelated. Hover a cell for the exact coefficient and how many paired rows it rests on — cells can rest on very different amounts of data when columns have gaps.
- Below the heatmap, the strongest relationships are listed in words ("amount × qty — moderate positive"). Click one — or click any cell — and the dialog switches to a live scatter plot of that exact pair, so you can see the shape behind the number. Back returns to the matrix.
- Switch between Pearson (straight-line relationships) and Spearman (rank-based: catches curved-but-consistent relationships and shrugs off outliers). If they disagree strongly, the relationship isn't a straight line — look at the scatter.
- Export the heatmap as a PNG. If the file has one or no numeric columns, the dialog says so rather than showing an empty grid.
Sample
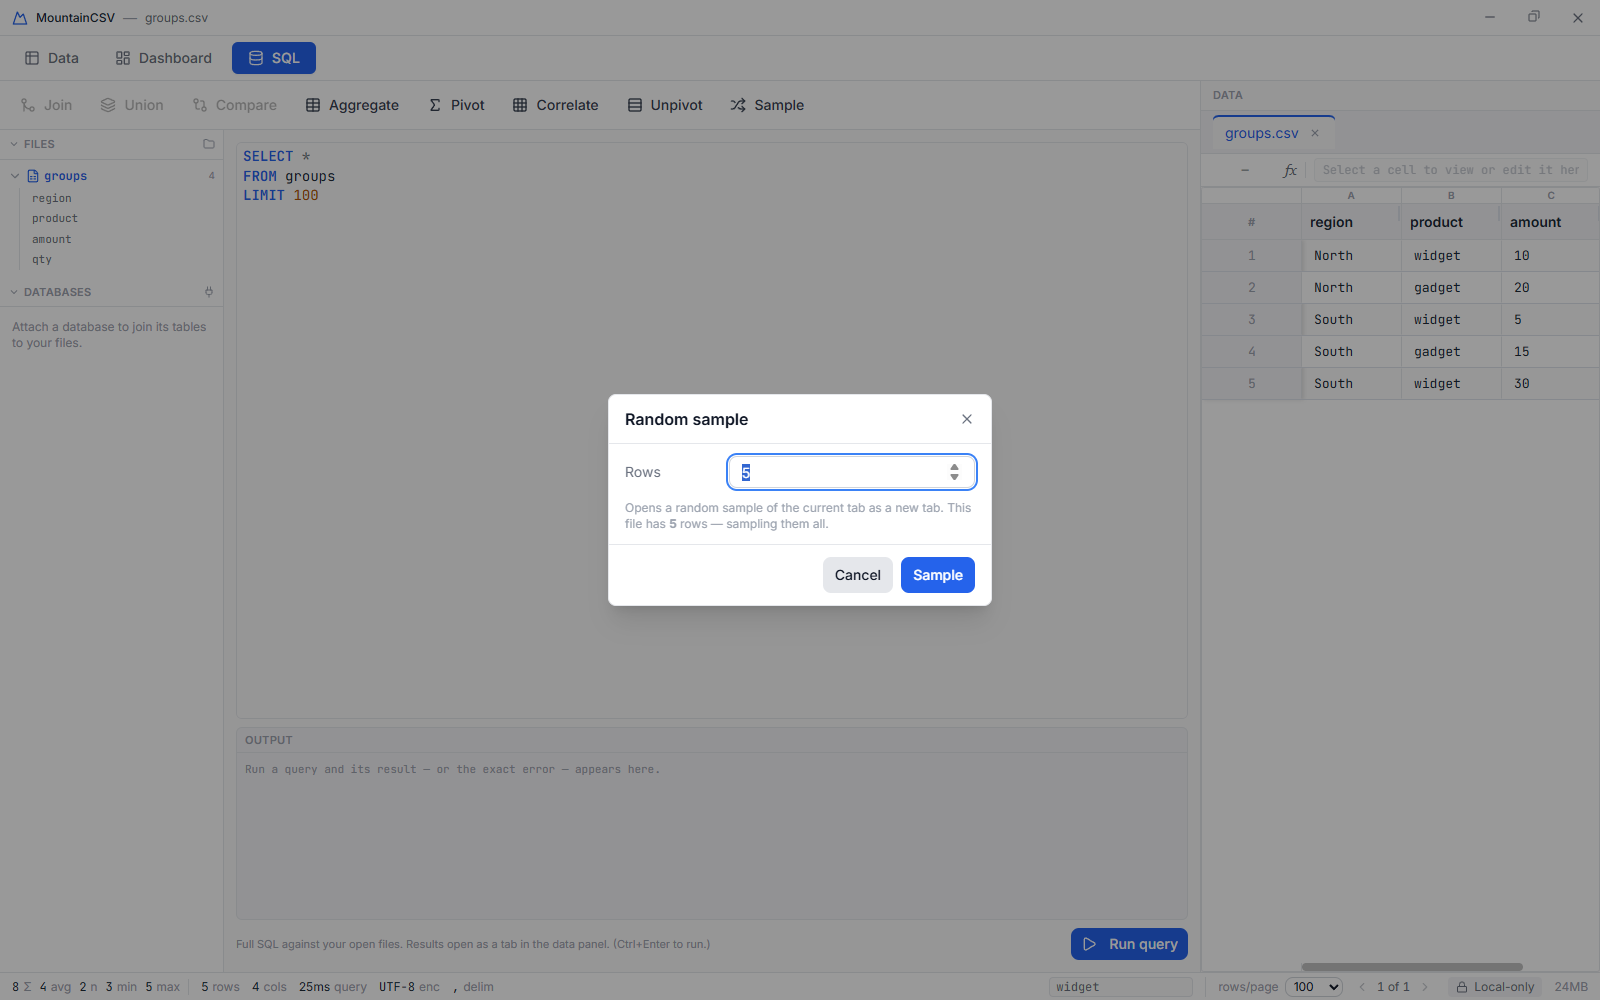
Pull a random subset of rows out of a huge file into a smaller, quicker tab.
- Click Sample, enter how many Rows you want (1000 by default), and click Sample.
- The sample opens as a new tab; the original is untouched.
Dashboard workspace
Click Dashboard in the top bar. The canvas fills the main area and your data sits in the panel on the right, so a chart and the rows behind it are visible at the same time.
Tiles
- Click KPI, KPI Strip, Chart, Frequency, Table, Slicer or Text on the dashboard toolbar to add a tile of that type.
- KPI shows a single number: pick a column and an aggregate (COUNT, SUM, AVG, MIN, MAX). KPI Strip shows up to six of those side by side in one tile. Frequency shows the most common values in a column with their counts, and Table shows a live extract of the data itself. Slicer is a clickable value list that filters every other tile. Text is free typing — a title, a note, a caveat. Chart is covered below.
- Every tile responds to the workspace filters — click a slicer value or a chart bar and the whole board narrows together (see Cross-filtering below).
- Click the ✎ icon in a tile's corner to edit it: its title, its column and aggregate, and its size on the grid (width in columns, height in rows) — or drag the tile to move it and its corner to resize.
- Click the bin icon to remove a tile.
- Your dashboard is saved per file. Close the app, reopen the same file tomorrow, and the board is exactly as you left it.
Auto-build
- Click Auto.
- MountainCSV reads the column profiles and builds a sensible starting dashboard: a total-rows KPI, a SUM KPI for up to three genuine numeric measures (identifier-like columns are skipped), and one breakdown chart — a bar chart counting by a low-cardinality text column, or a histogram of the first numeric column if there isn't one.
- Edit the tiles from there. Auto replaces the current board, so build it first and customise after.
Chart types
A chart tile can be any of six types, chosen from the tile's edit dialog: Bar, Line, Pie, Scatter, Histogram and Map. Each brings its own controls.
- Bar / Line / Pie need an aggregate function, a measure column (except for Count) and a group-by column. Bar also offers sorting, a Top N limit, vertical or horizontal orientation, grouped / stacked / 100%-stacked series, and value labels.
- Histogram needs one numeric column. Choose a binning rule — Sturges, Freedman-Diaconis, Scott, Sqrt, Doane or a custom bin count — and whether the y-axis shows frequency, density or a cumulative total.
- Scatter plots one numeric column against another.
- Map plots points from latitude and longitude columns; it auto-detects columns
named
lat/latitudeandlon/lng/longitude. Without geographic coordinates in your data, the other five types will be more use. - Click Run to draw the chart. Under a chart with controls visible, Show data table reveals the exact numbers behind it.
Editing & maximising a chart
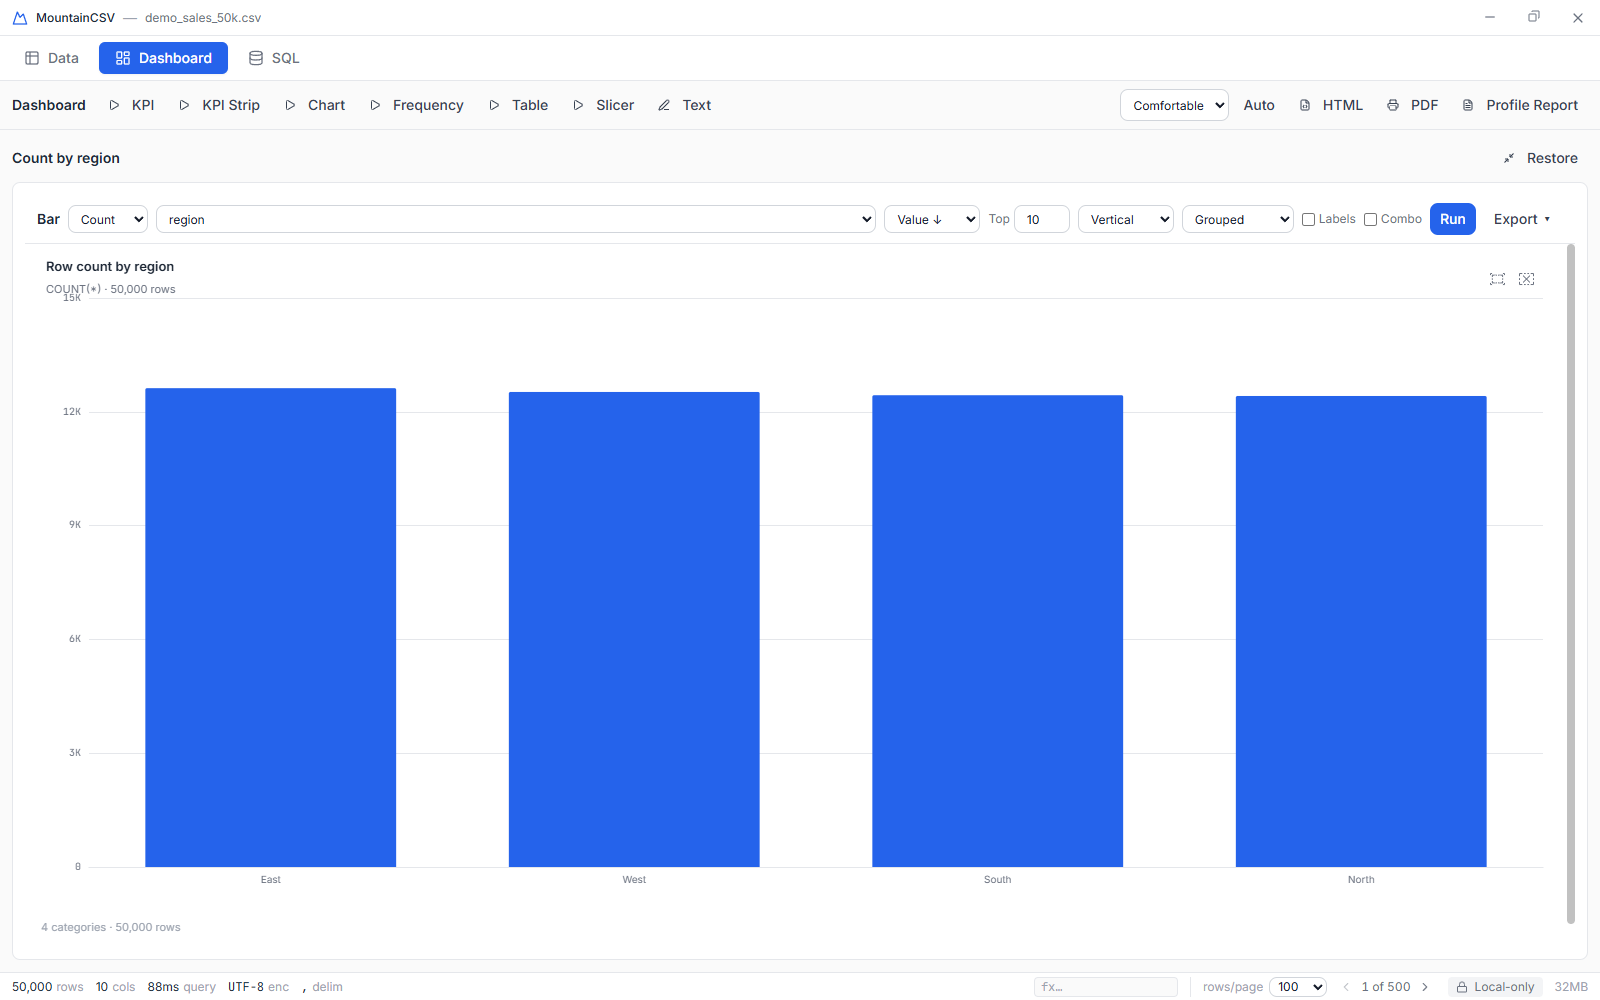
On the board, a chart tile shows just the chart — no controls — so the dashboard stays readable. Its controls appear when you open it properly.
- Click ✎ on the tile to set its title, type and size.
- Click ⤢ to maximise it. The chart fills the window, the data panel steps aside, and the full control strip appears so you can choose columns, aggregation and styling.
- Click Restore to go back to the board. Each tile keeps its own configuration, so two chart tiles never fight over one set of settings.
Cross-filtering
Charts aren't read-only pictures — clicking one filters the data beside it.
- Click a bar or a pie slice to filter the data to that category. Clicking another replaces the filter; Shift+click to add to it instead.
- Click a histogram bin to filter to that numeric range — everything from the bin's lower bound up to (but not including) its upper bound.
- On bar charts you can also brush across a region to select several categories at once.
- Whatever the chart applies shows up as filter chips over the data, so you can always see what's in play and remove it with one click.
Exporting a chart
- With the chart's controls visible — maximise the tile if they aren't — click Export ▾.
- Every chart type offers PNG and SVG.
- Bar, line and pie charts additionally offer CSV of the underlying chart data and Copy TSV to paste it straight into another document.
Exporting a dashboard
- Click HTML to save the whole board as a single, self-contained HTML file with real computed values baked in — KPI figures and table rows resolved at export time. It opens in any browser with no internet connection and no MountainCSV needed.
- Click PDF to send the same document to your operating system's print dialog, where you can choose "Save as PDF".
- Both buttons stay disabled until the board has at least one tile.
Profile report
A full data-quality report for the whole file, separate from the dashboard you build by hand. Where the column profile panel inspects one column at a time, this documents every column in one pass — types, null counts, distinct counts, ranges and the most common values.
- Click Profile Report on the Dashboard toolbar.
- Review the preview, then save it as HTML or send it to PDF.
Settings & global
Theme & density
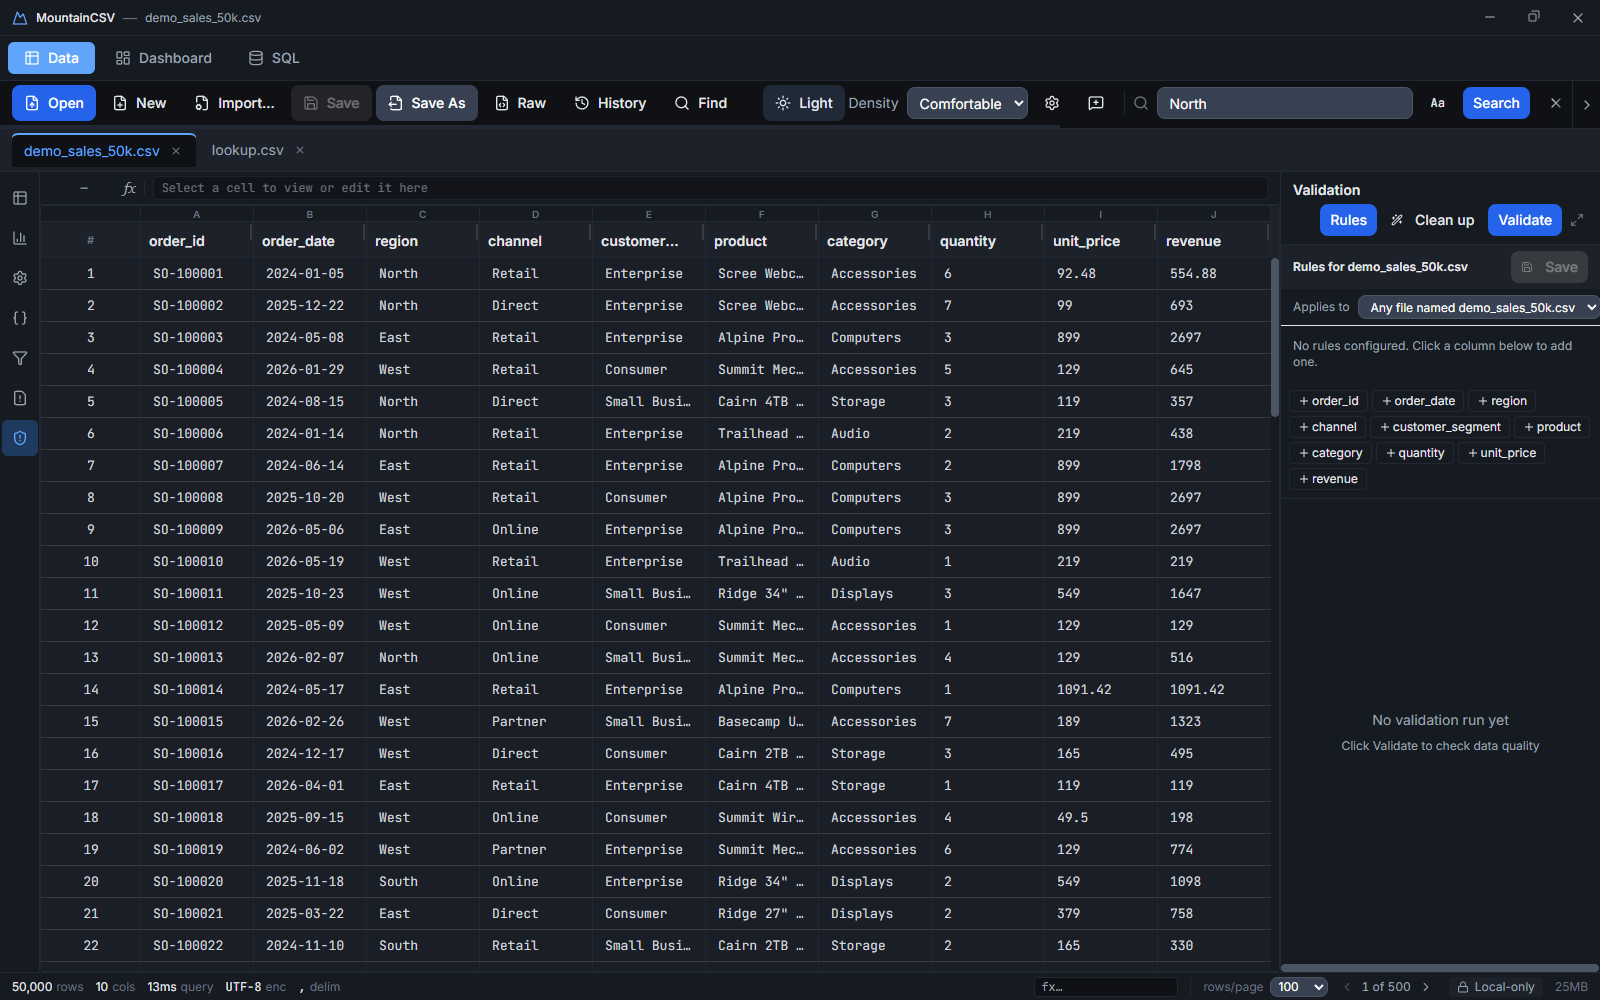
- Click Dark / Light on the Data toolbar to switch the whole app's theme, grid and charts included.
- Use the Density dropdown for Comfortable, Compact or Dense row heights — handy for fitting more rows on screen.
- Both settings are remembered between sessions.
Settings
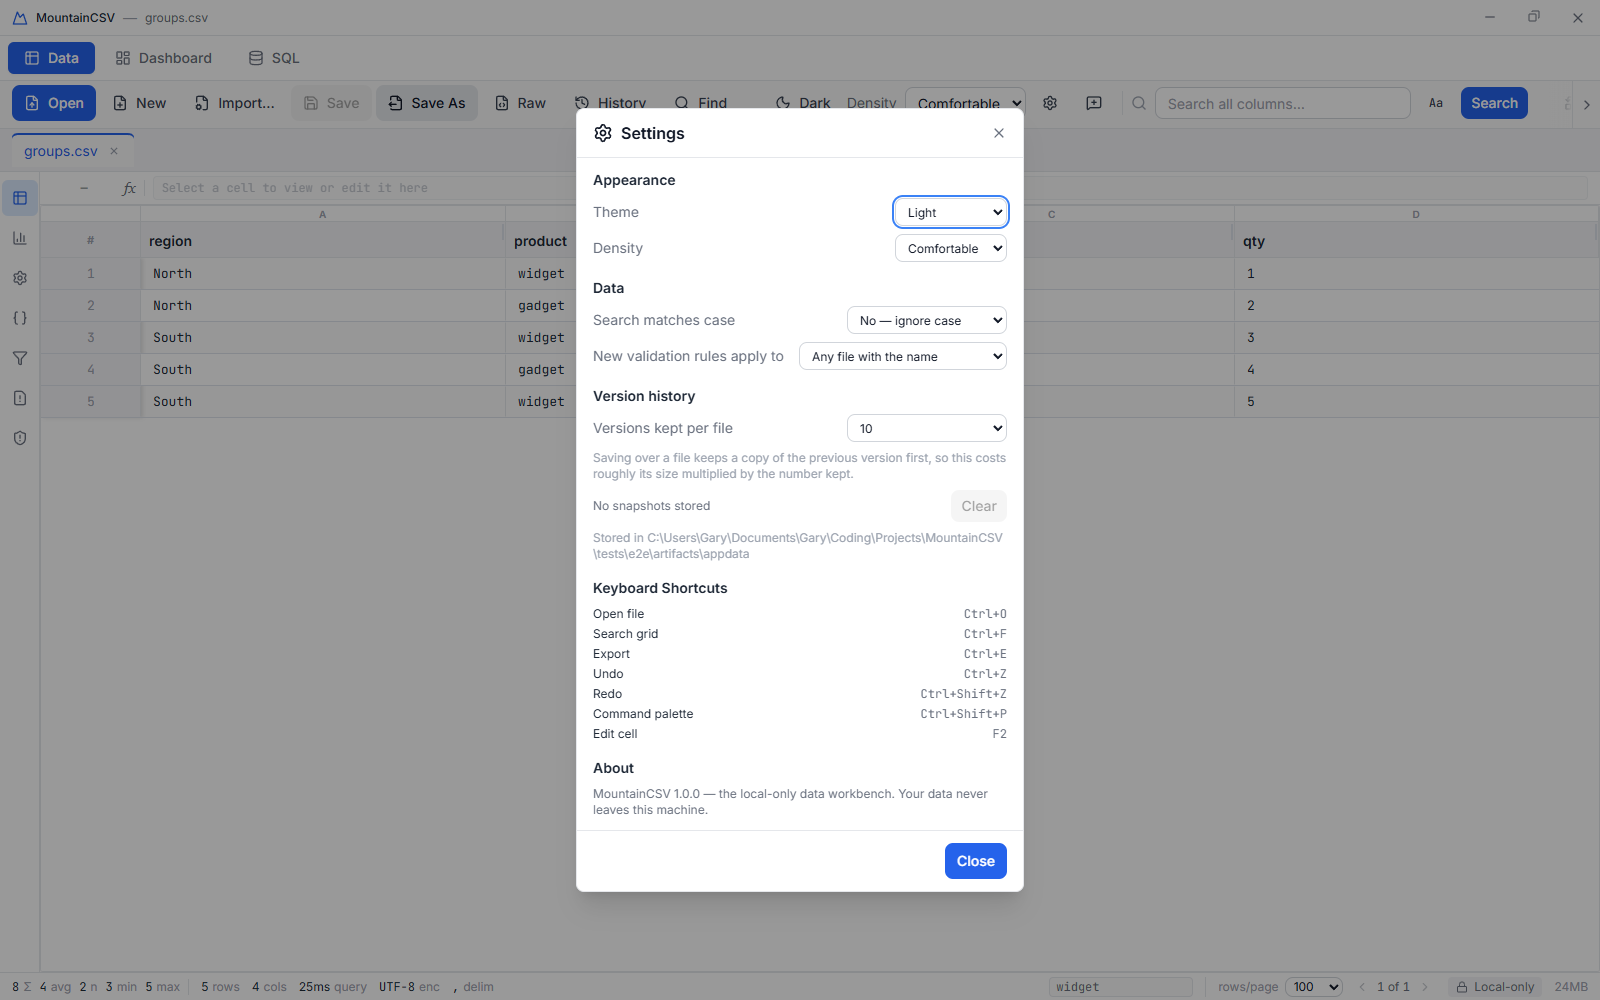
- Click the gear icon on the Data toolbar, or run Settings from the command palette.
- Appearance repeats the theme and density controls. Data sets whether search matches case and what new validation rules apply to. Version history chooses how many saved versions are kept per file, shows the space they use, and can clear them. Keyboard Shortcuts lists every shortcut.
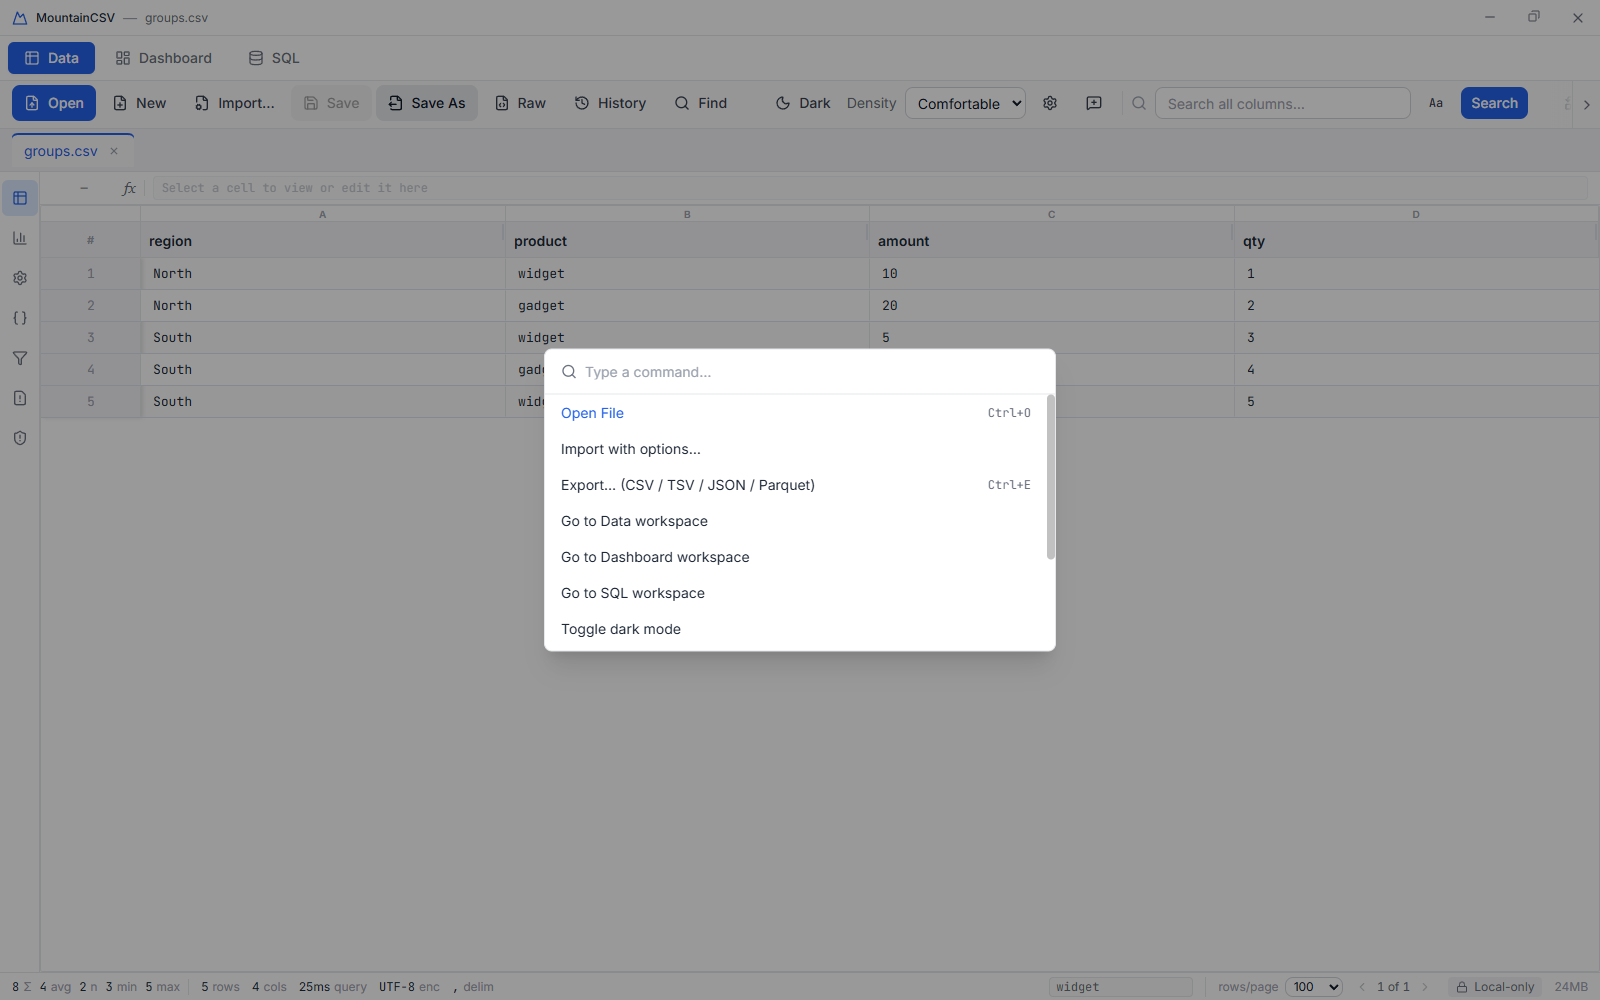
Command palette
- Press Ctrl+Shift+P from anywhere in the app.
- Type to filter, then press Enter to run a command: Open File, Import with options…, Export CSV, Settings, Send feedback, Undo and Redo.
File-changed detection
If a file you have open is edited by another program, the status bar shows a File changed on disk notice.
- Click Reload to pick up the new version from disk.
- Click Ignore to dismiss the notice and keep working on what's loaded.
Reporting a bug or requesting a feature
- Click the speech-bubble icon on the toolbar, or run Send feedback from the command palette.
- Choose Bug report or Feature request, give it a one-line summary, then fill in the detail — what you did, what you expected, and what happened instead. The more specific you are, the faster it can be fixed.
- Click Open in mail app. Your own email client opens with the message already written; read it over and press send. If you'd rather not use a mail client, Copy instead puts the same text on your clipboard.
If a specific file triggers a bug, a handful of dummy rows that reproduce it is far more useful than real records — and safe to share.
Buying MountainCSV
MountainCSV is bought through the Microsoft Store, which also manages a fully featured 7-day free trial — install it, use everything, and buy it once if it earns its keep. There are no keys to enter, nothing to activate and no account: the Store handles the purchase, and the app itself stays local-only — the status bar's permanent Local-only badge is there so you never have to wonder.
Reference
Keyboard shortcuts
| Shortcut | Action |
|---|---|
| Ctrl+O | Open a file |
| Ctrl+F | Focus the search box |
| Ctrl+E | Save the current tab to a new file |
| Ctrl+Z | Undo |
| Ctrl+Shift+Z | Redo |
| F2 | Edit the focused cell |
| Ctrl+C | Copy selected rows as TSV, with a header |
| Ctrl+D | Fill the focused column down into the selected rows |
| Ctrl+Enter | Run the query in the SQL editor |
| Ctrl+Shift+P | Command palette |
| Escape | Cancel an edit, or close a dialog or menu |
On macOS, use ⌘ wherever Ctrl is shown. The list is also available from Settings.
Formula functions
In-cell formulas start with = and support arithmetic
(+ - * / ^), comparisons (= <> < > <= >=), cell
references such as C1, and ranges such as A1:A10.
| Function | What it does |
|---|---|
SUM | Total of the values or ranges given |
AVERAGE | Mean of the numeric values given |
COUNT | How many numeric values there are |
MIN / MAX | Smallest / largest value |
IF | Condition, value if true, value if false |
AND / OR | Combine conditions |
CONCAT | Join values into one piece of text |
ROUND | Round to a number of decimal places |
A reference to a row that isn't on the current page returns #REF!, a value that isn't
a number where one is needed returns #VALUE!, and a formula that would depend on itself
is rejected outright.
price * quantity) rather than cell addresses, and
the database's own function library.
Import format details
| Format | Notes |
|---|---|
| CSV / TSV / delimited text | Comma, tab, semicolon, pipe and other delimiters detected automatically; handles quoted delimiters, embedded newlines, jagged rows and BOMs. |
| Compressed / encoded | Gzip-compressed files and a wide range of encodings (UTF-8, UTF-16 LE/BE, ISO-8859-1, Windows-1252, Windows-1251, GBK, Shift_JIS) are detected automatically, with a one-click override in Import Preview when detection gets it wrong. |
| Excel | .xlsx, .xls, .xlsm, .xlsb. The workbook's first sheet is loaded. |
| JSON / NDJSON | A single JSON array of objects, or newline-delimited JSON (.ndjson, .jsonl). |
| XML | The repeating element that represents a row is detected automatically. |
Exports are written as CSV, TSV, JSON or Parquet — see Export, Save & Save As.